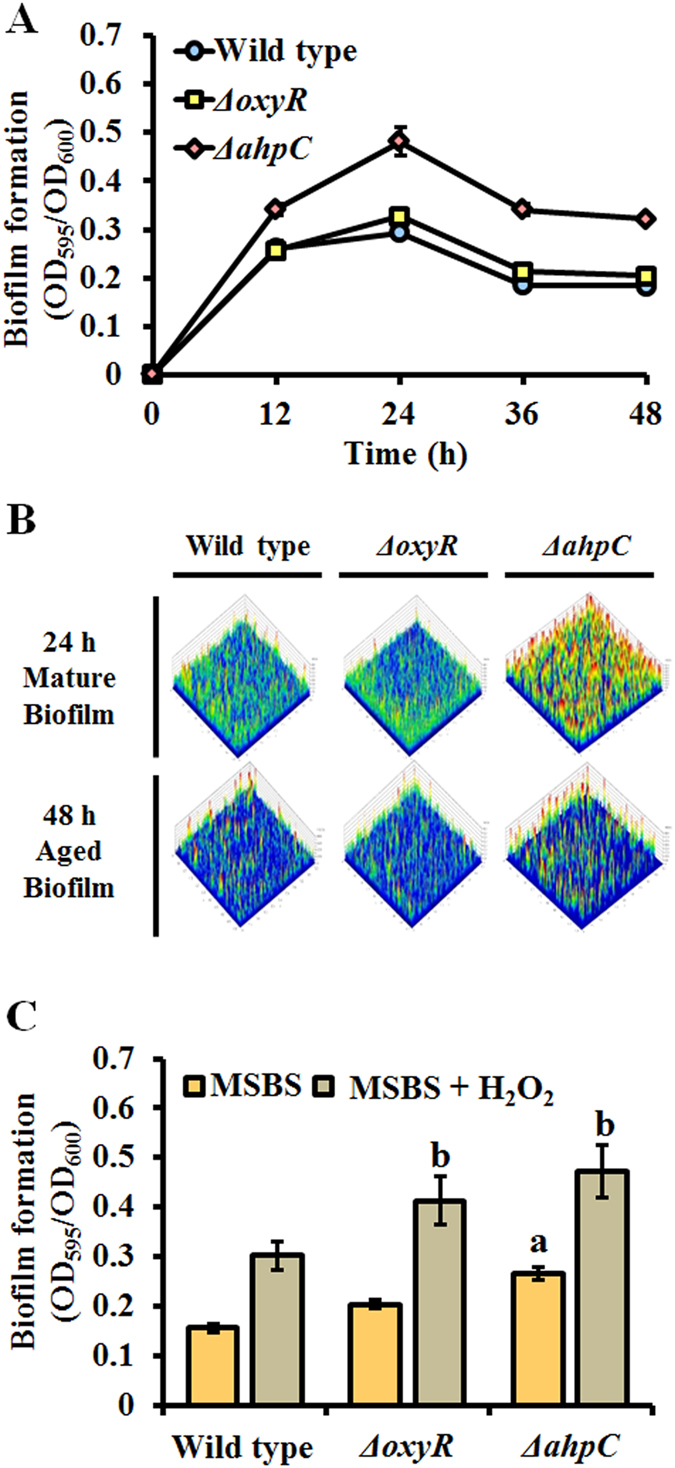
Figure 2. Quantification of biofilm formation under different conditions.

(A) Biofilm formation was measured in 48-well microtiter plates containing LB medium at 30 °C. The OD600 was used to normalize the data. (B) Three-dimensional images of biofilm structures at 24 and 48 h, obtained using CLSM. The images were obtained after using the live/dead cell staining dyes SYTO9 and PI, respectively. (C) Biofilm formation was measured in MSBS medium containing 100 μM H2O2 in 48-well microtiter plates at 30 °C. The OD600 was used to normalize the data. All samples were analyzed in triplicate. Statistical analyses were conducted using Student’s t-test. A letter on the bar graph indicates the level of significance.
