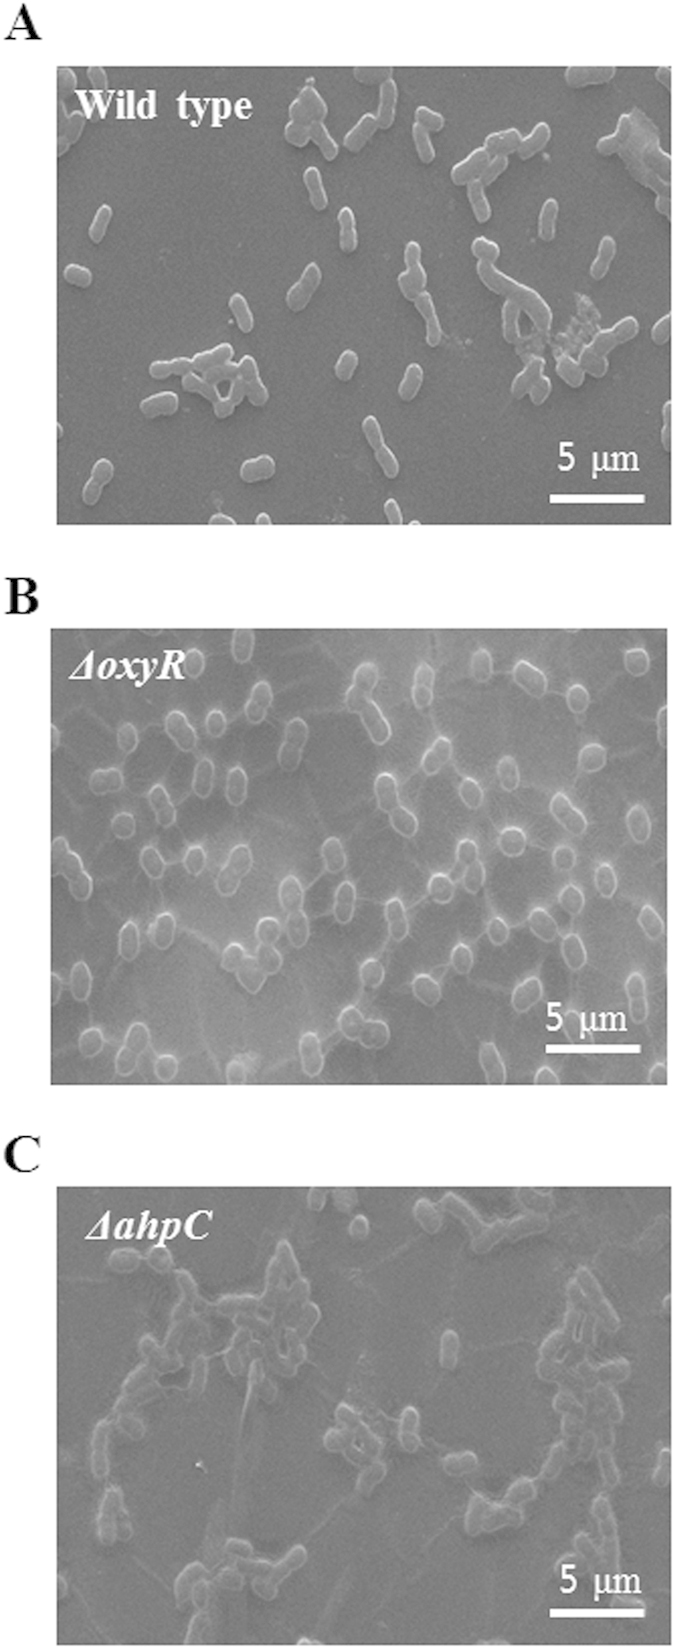
Figure 4. SEM analysis of EPS production in the ahpC mutant.

SEM images of (A) wild type, (B) oxyR mutant, and (C) ahpC mutant biofilms incubated for 24 h were obtained at 3,000 × magnification. Partial extracellular matrix-like structures were observed. All biofilm samples were fixed, dried, and coated with platinum (Pt) before imaging. Scale bars = 5 μM and 1 μM in the 3,000 × magnification images, respectively.
