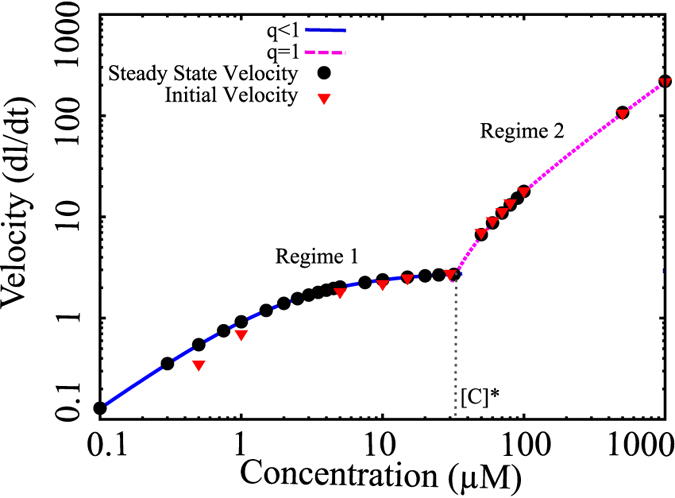
Figure 2. The concentration-velocity relationship shows two distinct regimes.

The solid blue curve and the dotted pink curves are analytically computed growth velocities. The black filled circles and red filled triangles represent the steady state velocities (fixed concentration simulations) and initial growth velocity (mass-conserved simulations), respectively.
