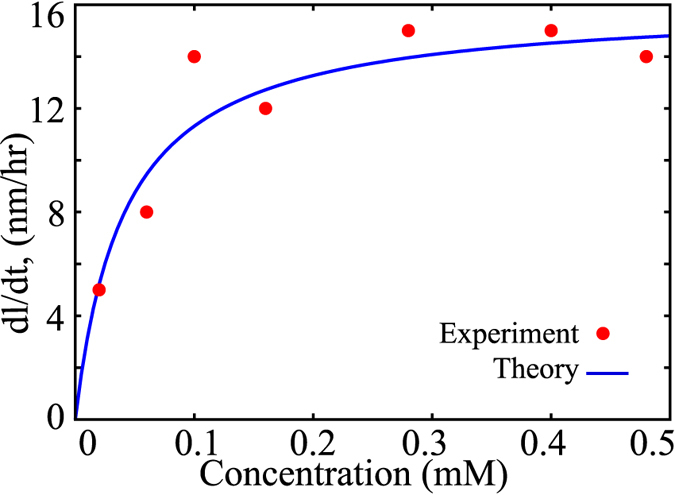
Figure 3. The analytical solutions for fibril growth velocity (solid blue curve) under constant concentration conditions shows a saturation at higher concentrations.

This is in agreement to the experimentally reported saturation in growth velocities (red dots)9. In order to fit the experimental velocities to our theory, we used the following parameters; i)  , ii) The ratio of magnitude of rate constants,
  and values of other parameters such
  is satisfied (see text).
