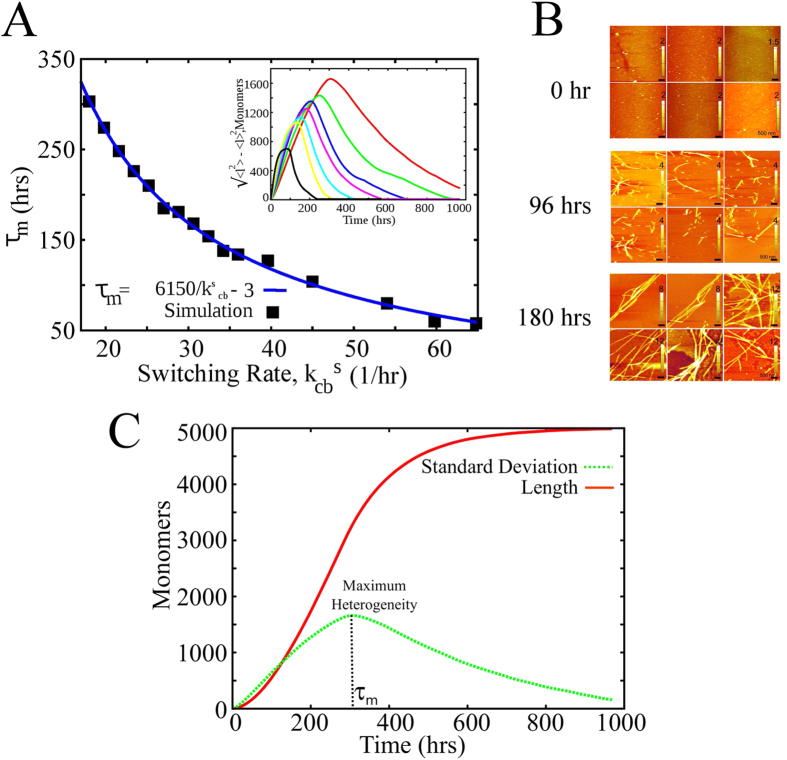
Figure 6.
(A) Relationship between the time of observation of maximum divergence,  and the conformational switching rate,
  . Inset shows filament length heterogeneity at various times during fibril growth. Each curve in the inset represents a standard deviation versus time plot for different values of conformational switching rate
  . (B) Atomic force micrographs at various time-points during α-synuclein fibrillation kinetics showing a homogenous initial population with negligible aggregation. At an intermediate timepoint, small aggregates coexist with longer filaments, thereby indicating a higher heterogeneity. At later timepoint, most of the filaments mature into longer fibrils. The scale bar in the AFM images is 500 nm. Height scales are depicted in individual AFM images. (C) A representative figure showing the filament length heterogeneity (σ) and the average length as a function of time from our mass-conserved simulation. The definition of
  is also shown in the figure.

