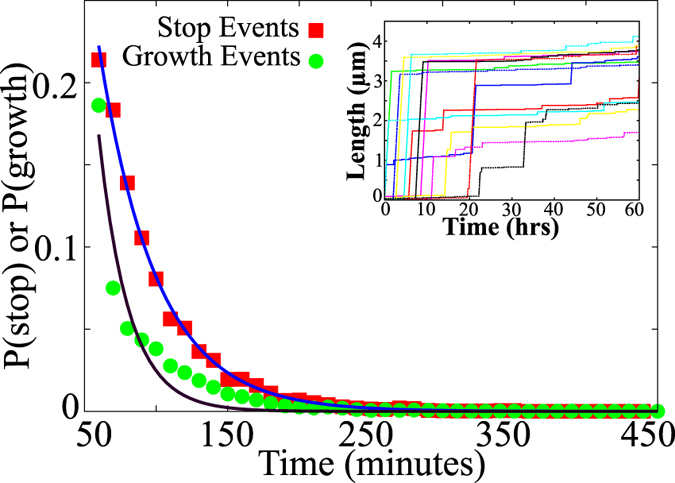
Figure 7. Distribution of growth timescales (green, circles) and stop timescales (red, squares) computed over the first 60 hours of filament growth.

The curves are exponential functions plotted as a guide to the eye. The inset shows filament growth kinetics from our model exhibiting stop and go kinetics. The results are consistent withe experimental findings10,11. The parameters used here are  ,
,  ,
,  ,
,  .
.
