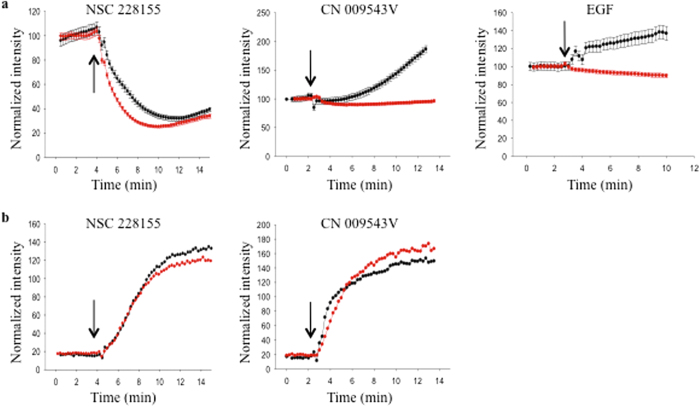
Figure 5. Detection of ROS in living cells exposed to NBD compounds by fluorescent microscopy.
MDA MB468 cells were incubated with or without PEG-catalase (500 U/ml) at 37 °C for 20 min. CellROX Deep Red reagent was added and incubation continued for 30 min to reach the steady state (controlled by fluorescence) followed by addition of NBD compounds (100 μM) or EGF (500 ng/ml). Fluorescence was simultaneously monitored at 665 nm to detect ROS (a) and at 520 nm to detect NBD compounds (b). Fluorescent curves for cells pre-incubated without PEG-catalase are shown by black circles and for cells pre-incubated with PEG-catalase by red circles. The arrow indicates addition of NBD compounds or EGF to cultures. Data are presented as means ± SEM.

