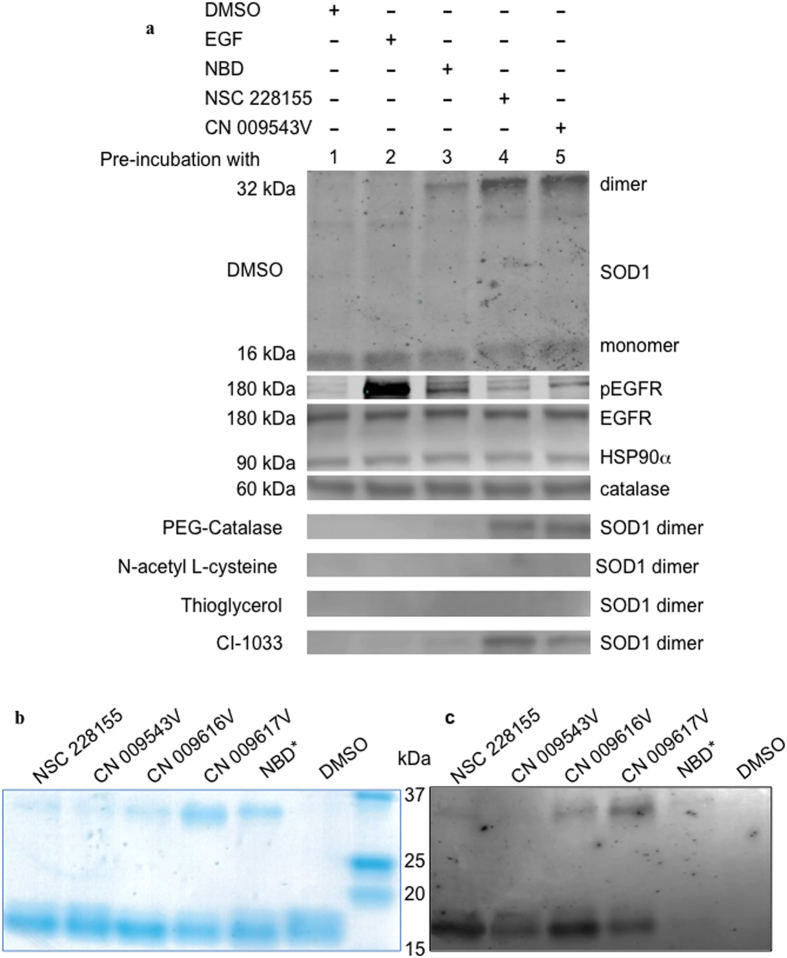
Figure 6. Dimerization of SOD1 in cancer cells exposed to lipophilic NBD compounds, and SOD1 exposed to NBD compounds in vitro.
(a) Western blot analysis of proteins in MDA MB468 cells pre-incubated with NAC (5 mM), PEG-catalase (500 U/ml), thioglycerol (5 mM) or CI-1033 (2 μM) for 30 min, and then exposed to NBD compounds (100 μM) or EGF (500 ng/ml) for 15 min. SOD1 monomers were present in all cells (shown only in cells pre-incubated with DMSO). (b) Detection of NBD compounds bound to purified human SOD1 with Coomassie staining. (c) Fluorescence detection of NBD compound/SOD1 complexes blotted onto NC membrane using a Typhoon 9410 scanner; the excitation wavelength was 488 nm and the emission wavelength was 526 nm.

