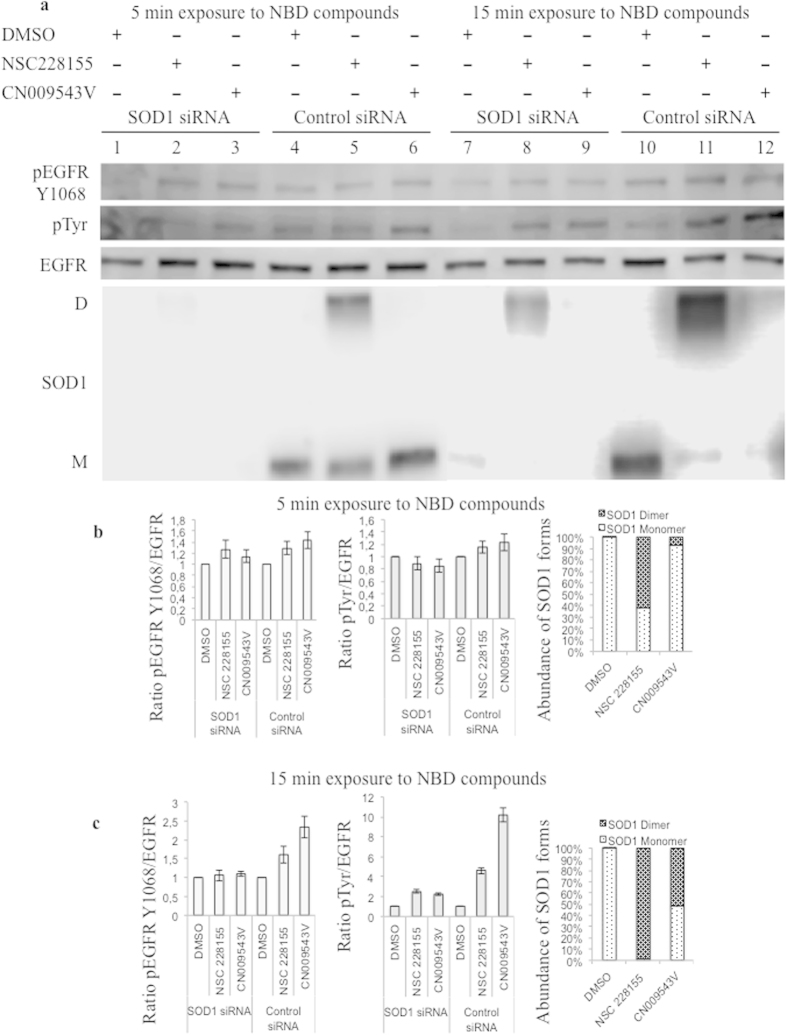
Figure 8. Comparison of EGFR tyrosine phosphorylation and SOD1 dimerization in cells transfected with SOD1 siRNA and scrambled siRNA after exposure to NBD compounds.
(a) Western blot analysis of EGFR phosphorylation and SOD1 dimerization after 5 min and 15 min exposures to 100 μM NBD compounds in MDA MB468 cells transfected with SOD1 siRNA or scrambled siRNA (Control siRNA). Quantitative analysis of the kinetics of EGFR phosphorylation and SOD1 dimerization after 5 min (b) and 15 min (c) exposures to 100 μM NBD compounds. The relative rate of EGFR phosphorylation was normalized to non-phosphorylated EGFR. The relative abundance of monomeric and dimeric forms of SOD1 was quantified as the ratio of corresponding bands (%) in the cells transfected with scrambled siRNA.

