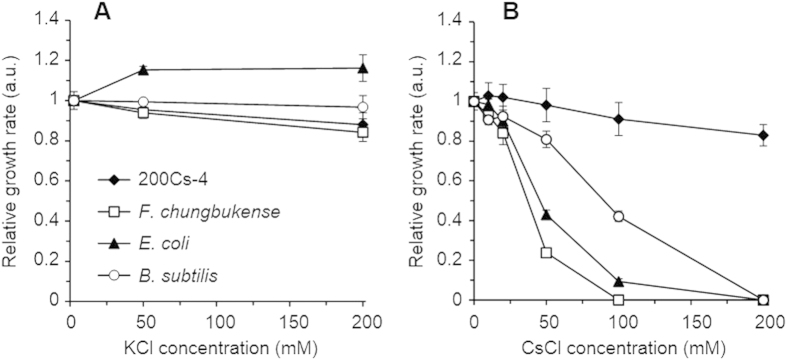
Figure 3. Effects of K+and Cs+ on the growth of the Cs+-tolerant isolate (200Cs-4), the closest relative of the isolate (F. chungbukense), and the reference microorganisms (E. coli and B. subtilis).
The relative growth rates of the four strains are plotted against KCl (A) and CsCl (B) concentrations. The growth rates determined from the respective growth curves (Fig. S1) were normalized against those in the basal medium (containing 2.5 mM KCl and no CsCl). Data are presented as the means of three independent cultures, and error bars represent standard deviations.

