
Figure 1.
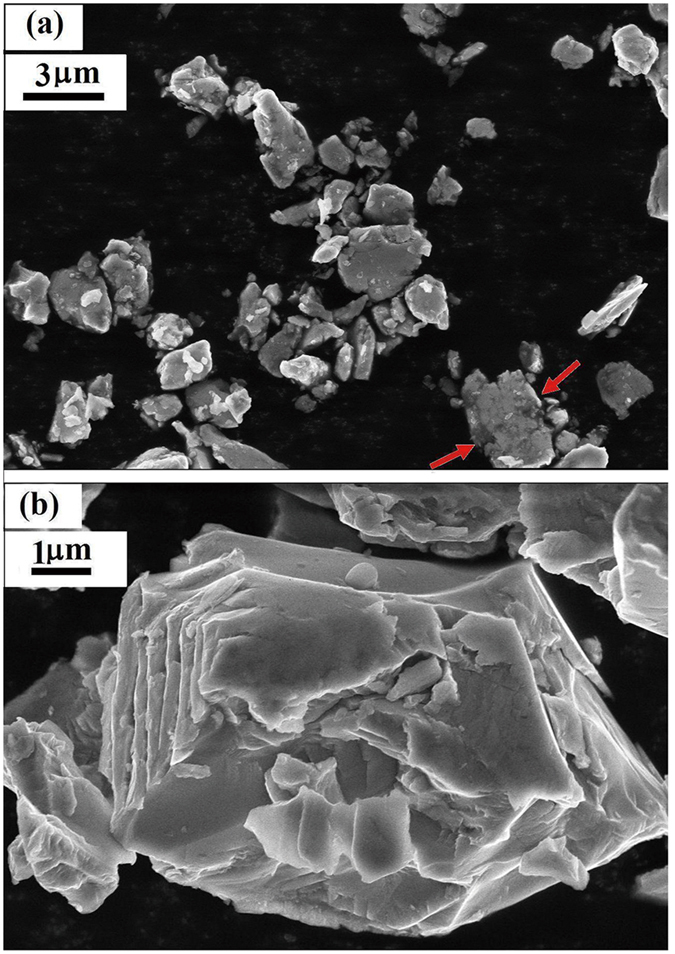
The SEM micrograph of particles (a) P6(1~3 μm), and (b) one particle of P4(5~10 μm) for Mn0.82Fe0.18NiGe.
Official websites use .gov
A
.gov website belongs to an official
government organization in the United States.
Secure .gov websites use HTTPS
A lock (
) or https:// means you've safely
connected to the .gov website. Share sensitive
information only on official, secure websites.
The SEM micrograph of particles (a) P6(1~3 μm), and (b) one particle of P4(5~10 μm) for Mn0.82Fe0.18NiGe.