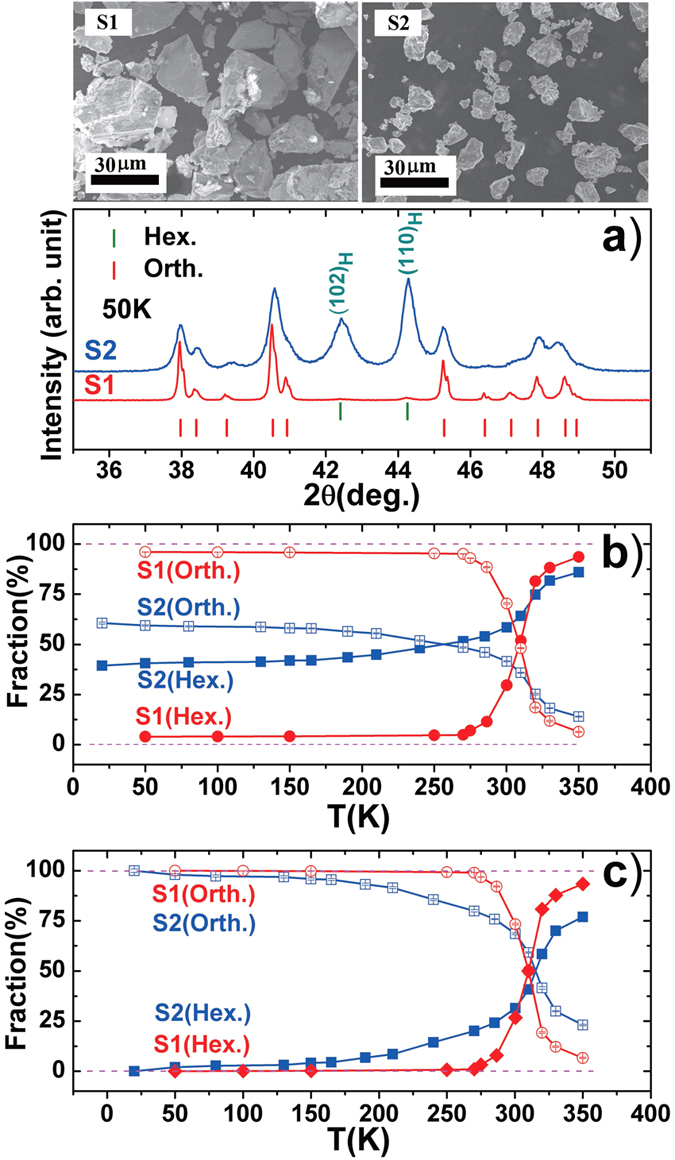
Figure 2.

The compared (a) XRD patterns collected at 50 K, (b) fractions of hexagonal and orthorhombic phases as a function of temperature, and (c) deduced results from (b) after deducting the fraction that lost magnetostructural transformation, for particles S1 (20~40 μm) and S2 (5~15 μm) of MnNi0.8Fe0.2Ge. For the intuition purpose, the morphology of the corresponding samples was given on the top of (a).
