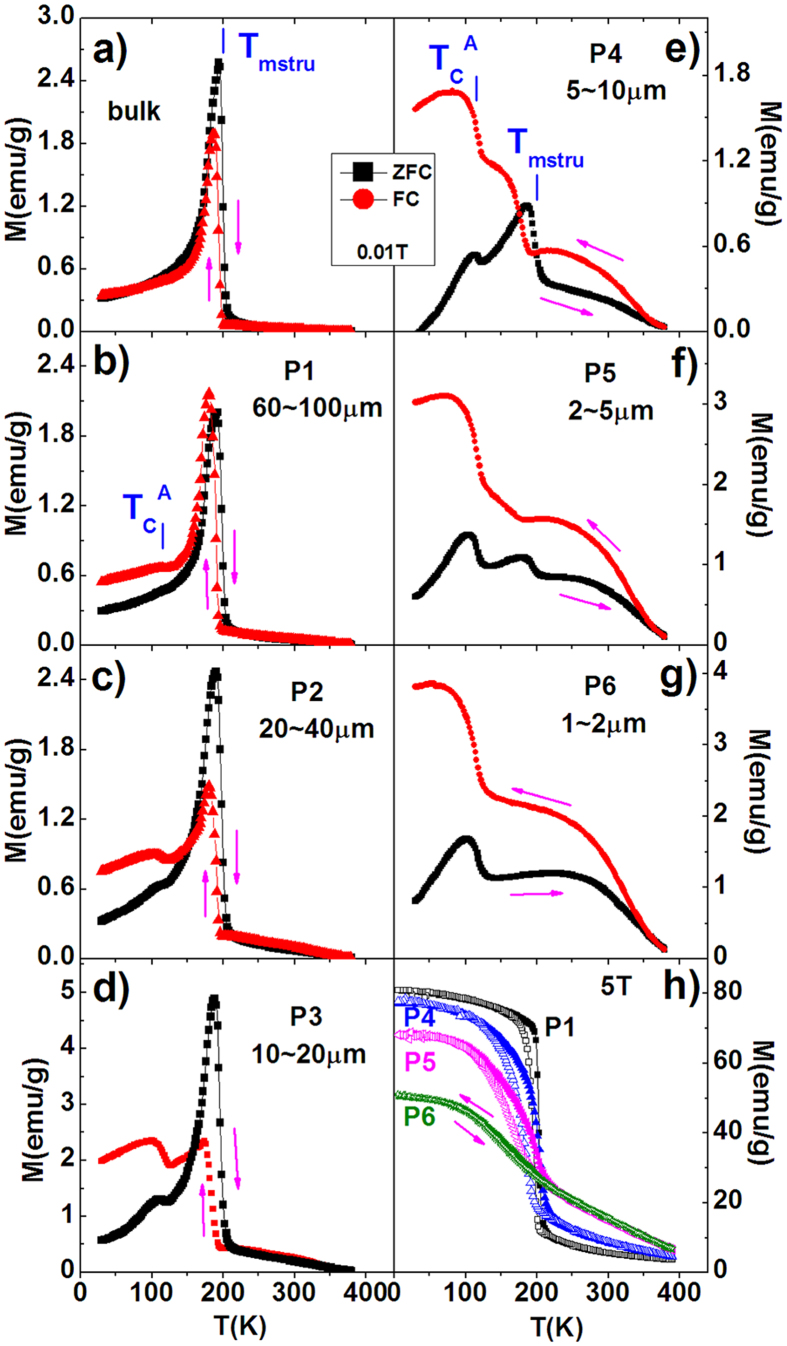
Figure 4.
ZFC/FC magnetization as a function of temperature (M-T curve) under 0.01T for (a) the bulk, (b) P1(60~100 μm), (c) P2(20~40 μm), (d) P3(10~20 μm), (e) P4(5~10 μm), (f) P5(2~5 μm), and (g) P6(1~3 μm) of Mn0.82Fe0.18NiGe. (h) presents the M-T curves under 5T for typical samples. The arrows indicate the cooling/warming paths.

