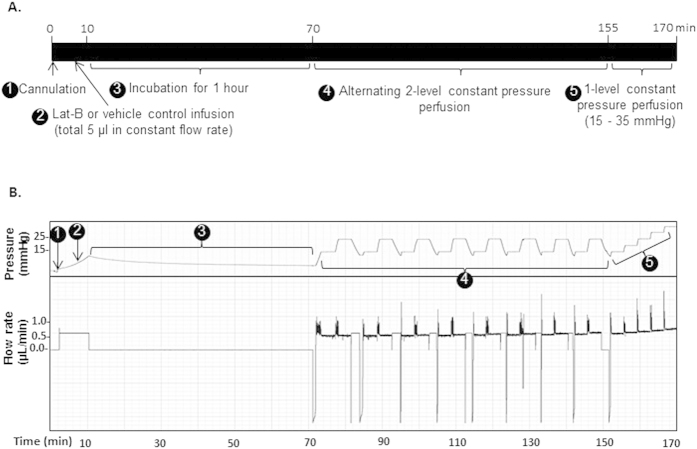
Figure 3. Schematic outline and representative perfusion pressure and flow rate traces following Lat-B anterior chamber delivery.
(A) Timeline of perfusion studies, (B) Representative pressure and flow rate trace following 5 μM Lat-B delivery. 1: 35-gauge needle cannulation of live mouse anterior chamber ➊, 2: Lat-B or vehicle delivery at a constant flow rate ➋ (0.63 μL/min, total 5 μl); 3: 1-hour incubation ➌. 4: alternating 2-level constant pressure perfusion at 15 and 25 mmHg for 8 cycles ➍, followed by 5: step-wise, incremental constant pressure perfusion at incrementally elevated pressures from 15–35 mmHg ➎. Y-axis scale: 1 mmHg and 0.05 μL/min per square; x-axis scale: 2 minutes per square.

