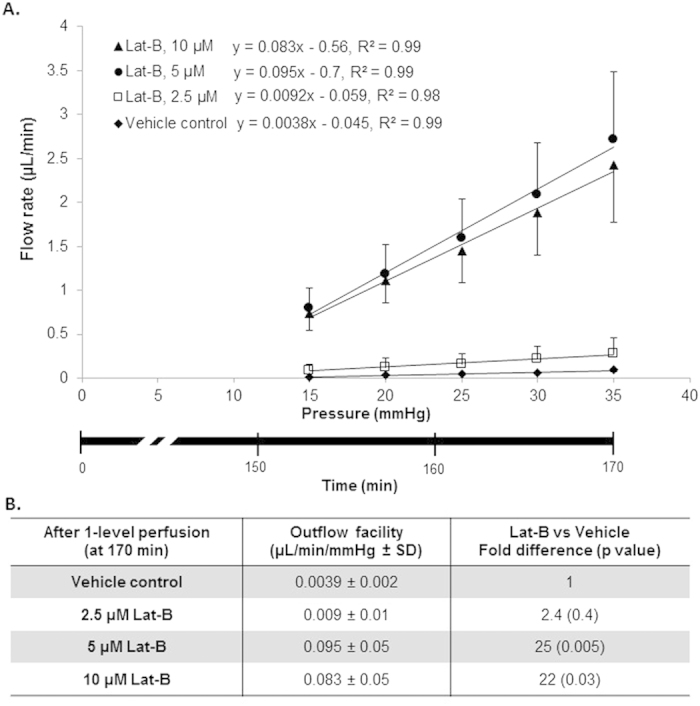
Figure 5.

Lat-B dose-dependently increased outflow facility based on step-wise, incremental constant pressure elevation that followed 2-level constant pressure perfusion (step ➎ in Fig. 3). (A) The relationship between perfusion flow rate and pressure fit a linear function within a pressure range of 15–35 mmHg. Outflow facility following 5 μM (n = 7) and 10 μM (n = 6) Lat-B was higher compared with 2.5 μM (n = 5) Lat-B (p = 0.005) and vehicle controls (ethanol 0.02%, n = 5, p < 0.01). Outflow facility following 2.5 μM of Lat-B was not significantly different from vehicle controls (p = 0.4). Data points: mean ± standard error of mean. Lower x-axis: time following 2-level constant pressure perfusion. (B) Statistical analysis of outflow facility based on constant pressure perfusion at step-wise, incrementally elevated pressures between 15–35 mmHg after live mouse anterior chamber Lat-B delivery. SD, Standard deviation.
