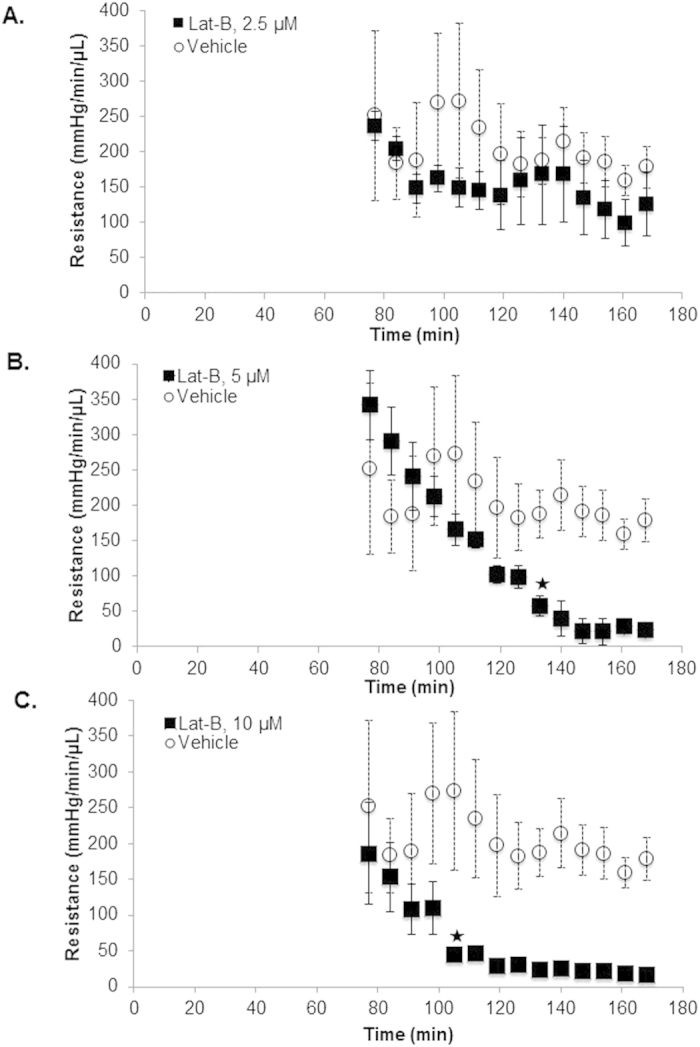
Figure 6. Outflow resistance functions following Lat-B exposure in live C57BL/6 mice.

Data points represent mean resistance (error bars: standard error of mean; mmHg/min/μL) following different doses of Lat-B ((A) 2.5 μM, n = 5; (B) 5 μM, n = 7; (C) 10 μM, n = 6) compared with vehicle (0.02% ethanol, n = 5). Star: time-point at which outflow resistance became significantly lower compared with vehicle controls (both p < 0.01).
