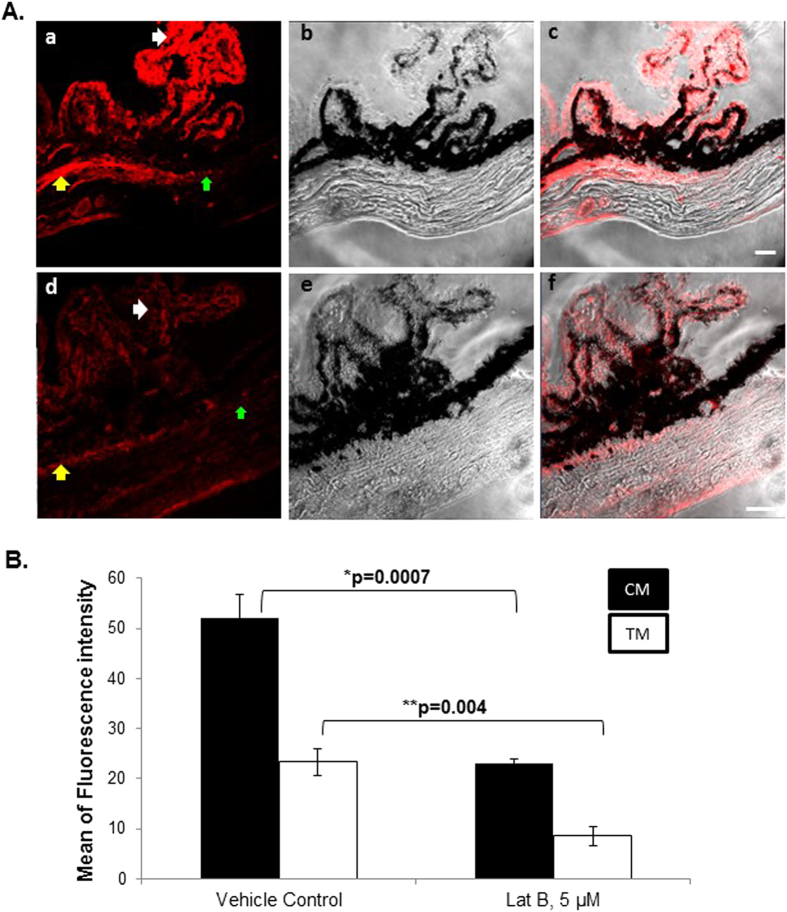
Figure 7. Live mouse anterior chamber Lat-B delivery decreased F-actin fluorescence labeling in aqueous drainage tissues.
(A) F-actin in vehicle controls (ethanol 0.02%, (a)), phase contrast image (b), merged F-actin labeling with phase contrast image (c), F-actin labeling following exposure to Lat-B (5 μM, (d)). Phase contrast image (e), F-actin labeling merged with phase contrast image (f). Yellow arrow: ciliary muscle (CM); green arrow: trabecular meshwork (TM); white arrow: ciliary process. Scale bar, 20 μm. (B) Quantitative analysis of F-actin fluorescence labeling in aqueous drainage tissues after Lat-B anterior chamber delivery in live mice. Fluorescence intensity (mean ± standard error of mean) was measured as grey pixel values in 8 regions of interest within TM or CM (n = 4 mice per label) following Lat-B (5 μM) or vehicle (ethanol 0.02%) exposure. In both CM and TM, F-actin fluorescence intensity was significantly lower following Lat-B exposure (p < 0.005).

