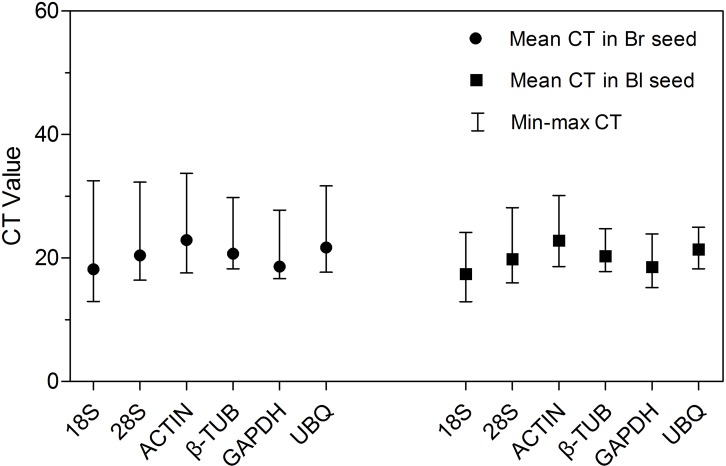
Figure 2. CT values of qRT-PCR for the six candidate reference genes.
Expression level of each reference gene displayed as CT values in all treatments in brown and black seeds, respectively. The medium, maximum and minimum CT values of each sample were calculated. Four biological replicates with two technical replicates of each for all samples were applied. Bl, black; Br, brown.

