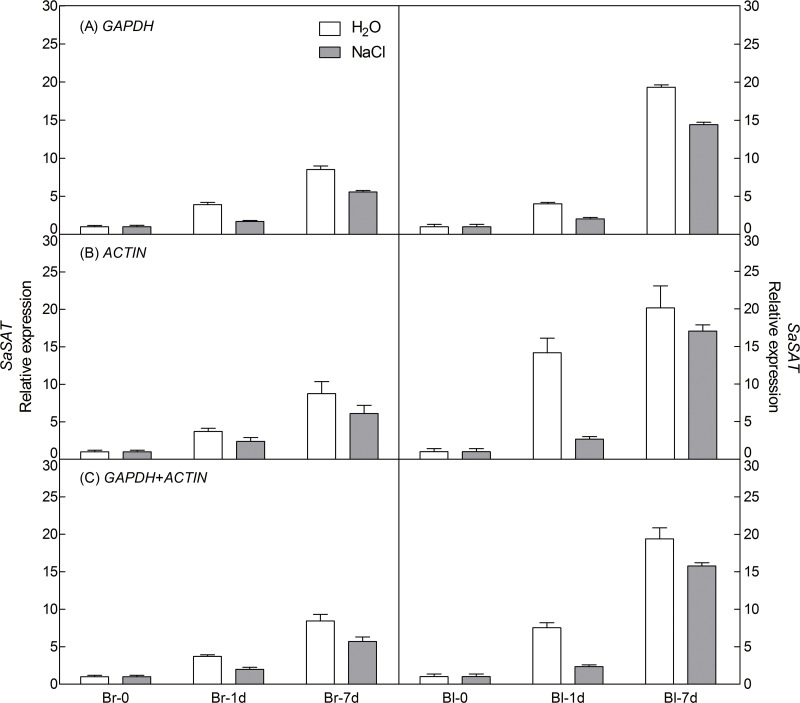
Figure 6. Relative quantification of SAT expression using the selected reference gene(s).
Relative expression of SAT was normalized using the single most stable reference gene GAPDH (A), ACTIN (B) and their combination GAPDH + ACTIN (C) in sample sets under 300 mM NaCl treatment. Bl, black seed; Br, brown seed.

