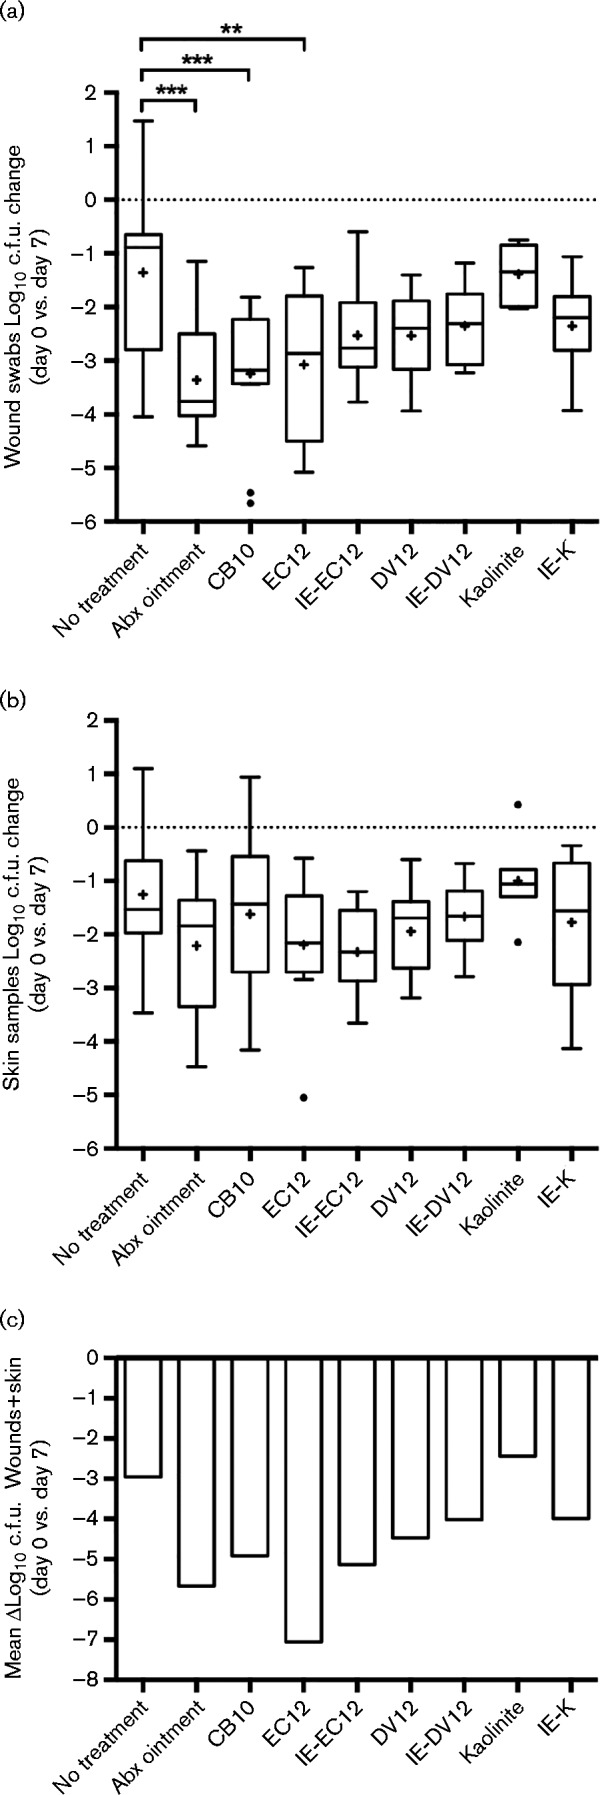
Fig. 2.

Recovery of viable MRSA cells from (a) wound swabs and (b) skin samples after 7 days of infection (no treatment), triple antibiotic ointment (Abx) application or experimental clay treatment. (a) Log10 c.f.u. fold change of MRSA cells recovered from wound swabs and (b) log10 c.f.u. g− 1 fold change of MRSA cells cultured from skin samples after 7 days of clay treatment. (c) The total log10 reduction in MRSA cells collected from wound swabs (mean value) (a) and skin samples (mean value) (b). Boxplots with median lines extend from the 25th to 75th percentiles and show Tukey whiskers. The dotted lines represent the normalized value of MRSA cells collected 4 h post-infection (inoculum control; day 0). The ‘+’ symbols represent the mean for each group. Outliers are displayed as filled circles. ***, P < 0.001; **, P = 0.0058.
