Fig 1.
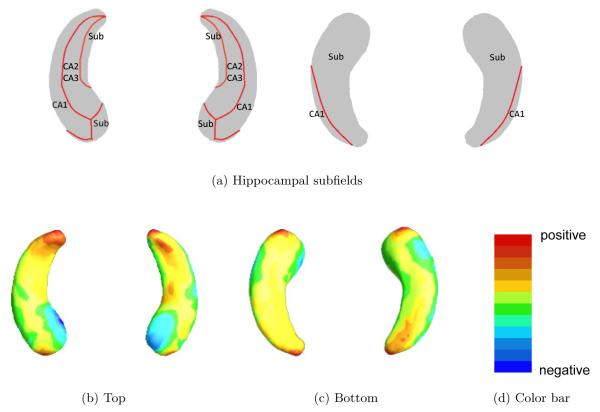
ADNI data: panel (a) is hippocampal subfields mapped onto a representative hippocampal surface [4], and panels (b) and (c), respectively, show the top and bottom views of the first subject’s hippocampal surface data color-coded by the colorbar in panel (d).

