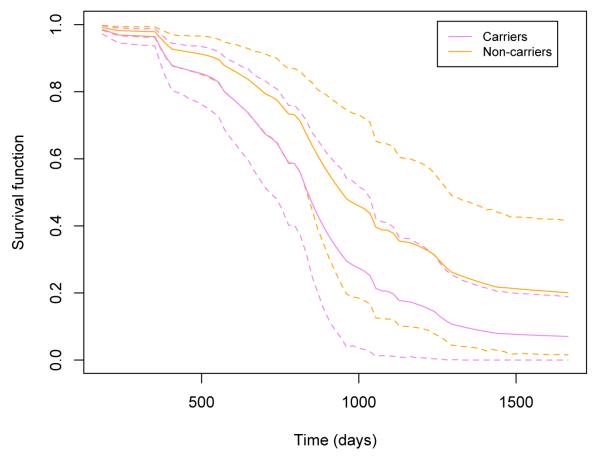
Fig 3.
ADNI data analysis results: the estimated survival curves of APOE-ϵ4 carriers and non-carriers under the full BFLCRM model. Other continuous or categorical covariates are fixed at the mean values or reference levels. The dotted lines show the 95% HPD intervals of the estimated survival functions.

