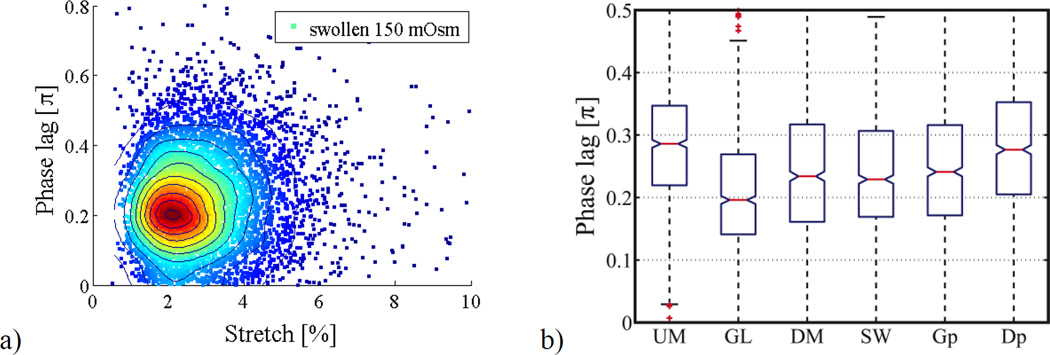
Figure 3.
(a) FACS-style scatter plot of swollen RBCs in hypotonic 150 mOsm buffer (n = 6500 cells, cells were replaced after 2 hr with fresh samples from the same donor to prevent drift due to effects of storage at room temperature on cell mechanical properties). (b) Population data (n = 1000) for unmodified (UM), 0.0025 % v/v glutaraldehyde fixed (GL), 3.8 mM diamide fixed (DM), 150 mOsm swollen (SW), mixed population glutaraldehyde:unmodified 70:30 (Gp), mixed population diamide:unmodified 70:30 (Dp) RBCs respectively. All populations tested the null hypothesis in a two-sample t-test vs unmodified RBCs (UM) at 5 % significance level, where samples GL, DM, SW and Gp had p < 0.001 while Dp had a p value of 0.08. Standard box plots show the middle 50 percentile of each population, the red line is the median and notches mark the 5% significance level around the median. Non-overlapping notches signify statistically different populations at 5% significance level.

