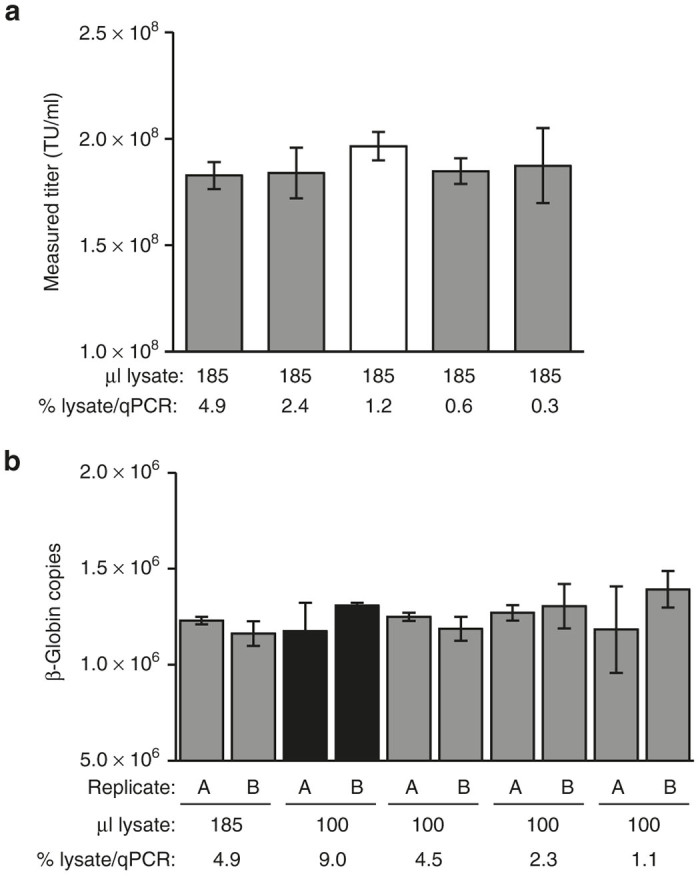
Figure 1.

Optimization of cell lysis and qPCR conditions for direct DNA extraction in a microtiter plate. (a) 293T-MLV-DCSIGN assay cells were transduced with VP02 and lysed in a final volume of 185 µl. qPCR for vector sequence was performed on a range of input cell lysate volumes, expressed as a percentage of the total cell lysate analyzed per qPCR. White bar indicates conditions similar to those described in the TCID50 protocol for AAV.10 Error bars are mean ± SD for qPCR quadruplicates. (b) 293T-MLV-DCSIGN assay cells were lysed in a final volume of 100 or 185 µl and analyzed by qPCR for cellular β-globin as an indicator of DNA recovery. Cell lysis was performed in duplicate within a single experiment (replicates A, B); error bars are mean ± SD for qPCR triplicates. Black bars indicate DNA extraction conditions and subsequent qPCR sample volume chosen for in situ transduction titer assay. TU, transduction units.
