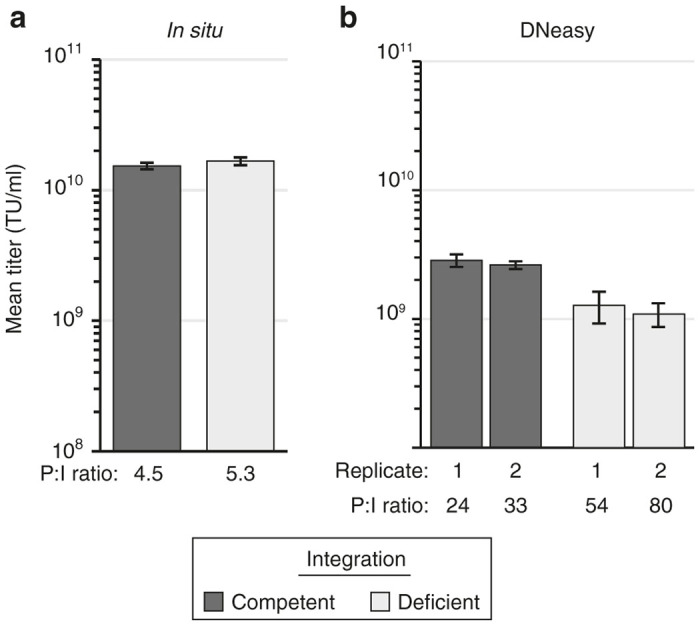
Figure 2.

Comparison of vector transduction titers measured following in situ versus spin column (DNeasy) DNA extraction. 293T-MLV-DCSIGN assay cells were transduced with equivalent amounts of integration-competent or -deficient vector particles (as measured by vector genomes). Following an overnight incubation, DNA was isolated, and samples were analyzed by qPCR to detect vector sequence. (a) Extraction performed using in situ method. Each bar represents the mean ± SD of nine transductions performed in parallel (n = 3 qPCR replicates/transduction). (b) Extraction performed using DNeasy column (5 × 10⁴ cells loaded per column). Each bar represents the mean ± SD of qPCR triplicates for a single transduction; two transductions were performed in parallel for each vector tested (replicates 1, 2). Particle-to-infectivity (P:I) ratios were calculated by dividing the physical particle titer (measured by RNA genome content per vector) by the measured transduction titer. Results in both panels are representative of two independent experiments. TU, transduction units.
