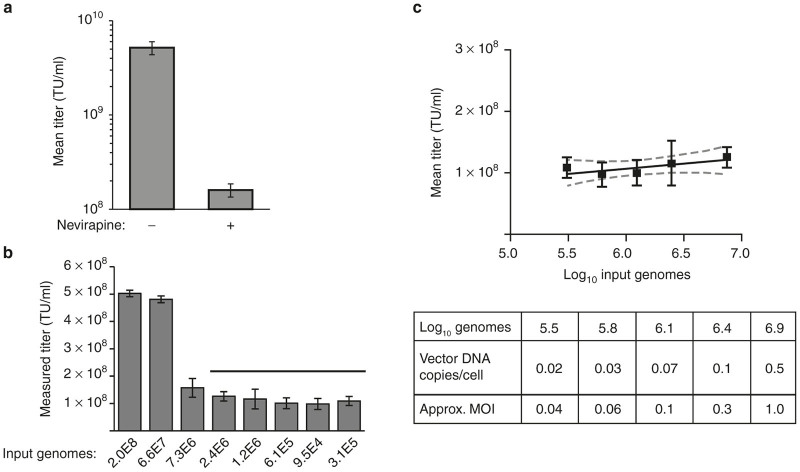
Figure 4.
Evaluation of specificity and linear response range of the 96-well transduction titer assay. (a) Research-grade lentiviral vector treated with benzonase and purified by centrifugation through a sucrose cushion was analyzed using the 96-well transduction titer assay performed in the presence or absence of nevirapine, an inhibitor of reverse transcriptase. Error bars are mean of n = 4 transduction replicates performed in a single experiment ± SD (n = 3 qPCR replicates/transduction). (b) Serial dilutions of GMP-manufactured VP02 vector were titered using the method described in Figure 3a. Error bars are mean of n = 3 transduction replicates ± SD in a single experiment (n = 3 qPCR replicates/transduction). Graph is representative of four independent experiments. (c) Dilutional linearity analysis for data points indicated by horizontal bar in b. The slope of the line is not significantly different from zero (P = 0.1), as analyzed by GraphPad Prism 6. Vector DNA copies/cell assumes two cell doublings between cell seeding and time of harvest. The approximate MOI was calculated from the measured transduction titer at the corresponding vector input amount, assuming one cell doubling at time of transduction. MOI, multiplicity of infection; TU, transduction units.

