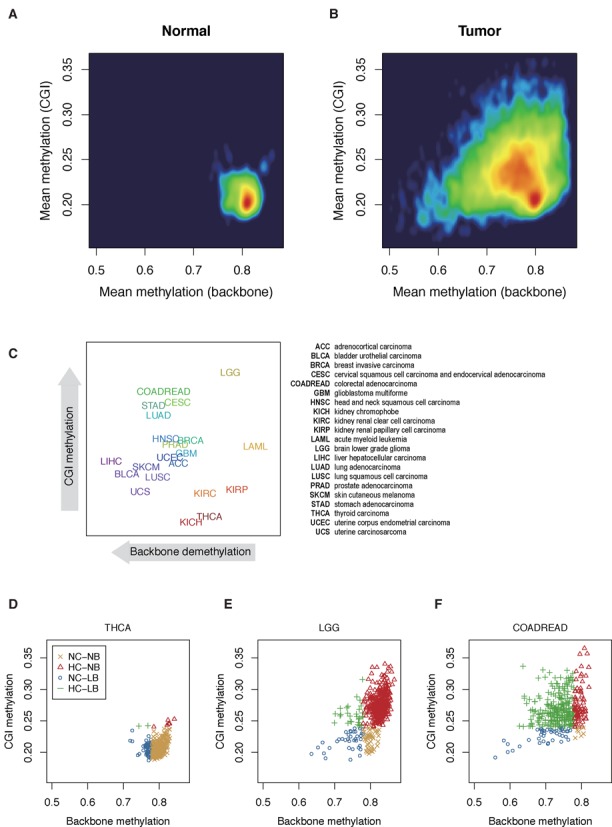
Figure 1.

Distribution of genome-wide average CGI and backbone methylation in normal and tumor tissues. (A) Normal adjacent tissues have average CGI methylation around 0.2 and average backbone methylation around 0.8 within narrow limits. (B) Tumor cells have variable degrees of CGI methylation and backbone demethylation. (C) The distributions of abnormal methylations according to tumor types. Tumor names are presented at median levels of CGI and backbone methylation in each tumor type. (D) THCA cases are distributed mostly in normal ranges (NC-NB). Abbreviations: NC, normal CGI methylation (≤0.24); HC, high CGI methylation (>0.24); NB, normal backbone methylation (≥0.78); LB, low backbone methylation (<0.78). (E) LGG cases are distributed mostly in the CGI-methylated zone (HC-LB). (F) Most of COADREAD cases are both CGI-methylated and backbone-demethylated with variable degrees.
