Figure 1.
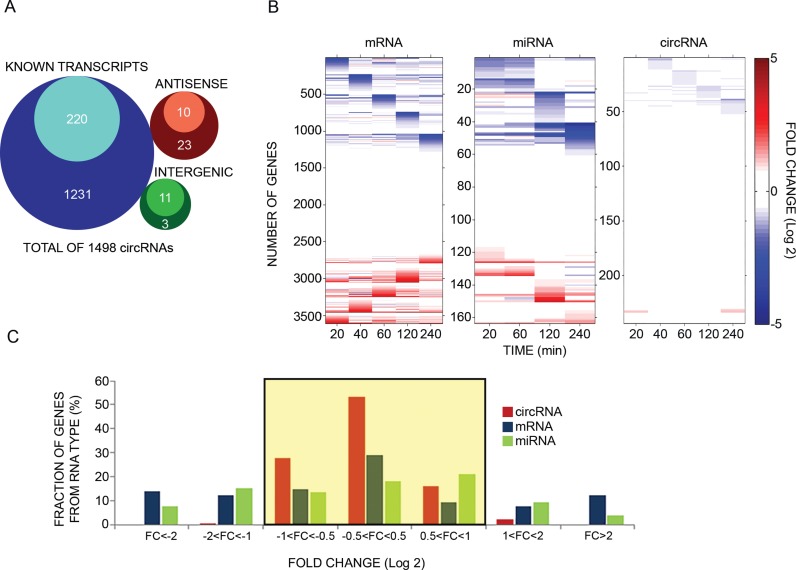
Unlike mRNAs and microRNAs, circular RNAs of mammary cells display minor changes in response to an extracellular cue. (A) Venn diagrams presenting genomic origins of circRNAs found in MCF10A mammary cells. The analysis comprises 1498 circRNA molecules we identified in MCF10A cells using RNA-sequencing. Of these, 1451 molecules (97%) overlap known transcripts. The remainder 47 circRNAs are either intergenic (14 transcripts) or antisense to known transcripts (N = 33). Inner circles represent Quantified fractions, meaning transcripts we followed also by using PCR; For circRNAs derived from known transcripts, the majority (>90%) of the Quantified fraction refers to circRNAs, the response of which to EGF was assayed using divergent and convergent sets of primers, while for the remainder of the Quantified fraction, including circRNAs derived from either antisense or intergenic regions, measurements were performed using only divergent sets of primers. (B) MCF10A human mammary epithelial cells were starved overnight for serum factors. Thereafter they were treated with EGF (10 ng/ml) for the indicated time intervals. High-throughput PCR and specific primers were applied on isolated RNA samples to amplify 241 of 1498 circRNA species previously identified using RNA sequencing. This group included >50% of the most abundant candidates, along with dozens of other circRNAs with varying expression levels. The presented heatmap (right panel) depicts time-dependent alterations in expression levels of specific circRNAs. These alterations are compared to mRNA and microRNA alterations we previously observed, using microarrays, while stimulating MCF10A under identical conditions (5,36). Note that all previously analyzed miRNAs are represented, but in order to match the size of the circRNA population, only randomly selected, 16.1% of all MCF10A's mRNA molecules, are depicted in the heatmap. Data were normalized to time zero and ordered according to the time point corresponding to the maximal change. Red squares represent an increase and blue squares represent a decrease, as shown in the scale bar on the right. CircRNA results represent biological duplicates performed in technical triplicates. (C) A histogram showing the range of abundance changes of mRNAs, miRNAs and circRNAs (N = 3608, N = 164 and N = 288, respectively) displayed by EGF-stimulated MCF10A cells. To construct the histogram, the maximal change value (induction or repression) along the stimulation interval (240 min) was found for each RNA molecule. Note that circRNAs exhibit narrower dynamic range (highlighted region) than mRNAs and miRNAs (P < 1e-100, F-test, Bonferroni corrected for multiple comparisons). Note that only 3 time points (30, 90 and 240 minutes) were available for 47 of the presented circRNAs.

