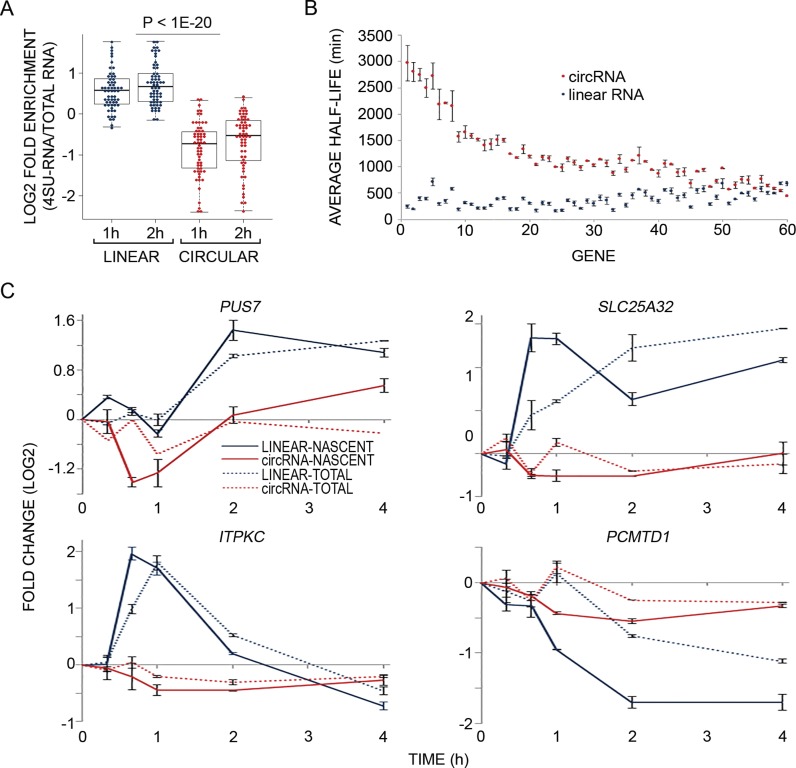
Figure 3.
Analysis of newly transcribed RNAs reveals that circRNAs are more stable and static than the linear isoforms derived from the same host genes. (A) MCF10A cells were treated with EGF as in Figure 1B and RNA was simultaneously metabolically labeled using 4-thiouridine (4sU), for the indicated time intervals. RNA was extracted (Total-RNA) with Trizol, biotinylated and purified on streptavidin magnetic beads (denoted 4sU-RNA). Flow-through RNA was also collected (denoted FT-RNA). Thereafter, RNA was reverse transcribed and quantified using high-throughput real time PCR (Fluidigm). The boxplot diagram shows enrichment of newly transcribed RNA (4sU labeled) in linear isoforms (blue dots) relative to the respective circRNA isoforms (red dots; P < 1e-20, t-test, two-tailed distribution, unequal variance, Bonferroni corrected for multiple comparisons, N = 61). Shown are the log2 fold enrichments of 4sU-labeled RNA versus total RNA (Y axis). (B) MCF10A cells were metabolically labeled using 4sU, for 1 or 2 h. Thereafter, RNA was extracted, biotinylated and purified on streptavidin magnetic beads. Flow-through RNA was also collected. Next, RNA was reverse transcribed and quantified using high-throughput real time PCR (Fluidigm). Presented are the half-lives of 60 circRNAs and their corresponding linear counterparts. Half-life values were calculated from two samples, which were labeled with 4sU for 1 or 2 h and then averaged. All data were corrected for any bias introduced due to low uridine (short length) of RNA species (see ‘Materials and Methods’ section). The circRNAs (red dots) and their linear counterparts (blue dots) were sorted according to the difference between their half-lives from high to low. Error bars represent standard errors. The calculations of half life were performed using the HALO software (39) and the ratios between newly transcribed (RNA-4sU) and pre-existing RNAs (RNA-FT). (C) PCR and four pairs of primers were used to follow the response of newly transcribed RNA (solid lines) and total RNA (dashed lines) of both linear and circular isoforms of the indicated EGF-regulated genes. Shown are calculated fold changes of expression levels displayed by EGF-treated cells relative to basal (unstimulated) expression levels, measured in cells labeled with 4sU for the indicated intervals (Y axis). Shown are means ± S.E. of duplicates.

