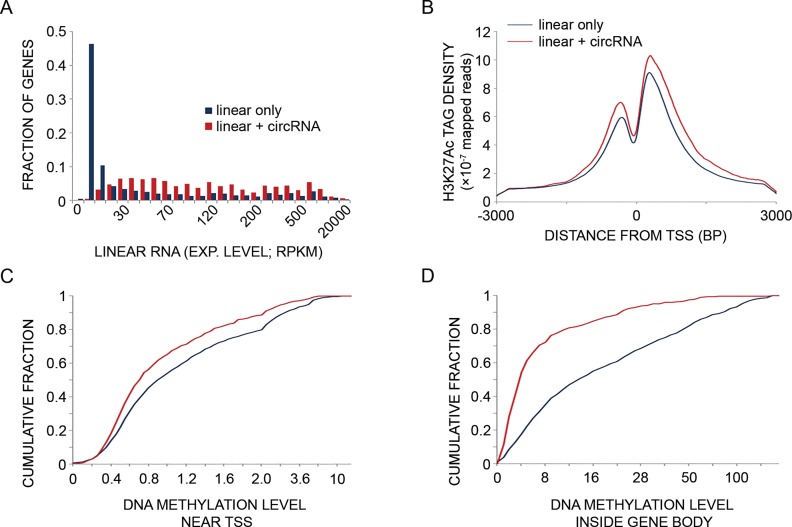
Figure 4.
Genes giving rise to circRNAs frequently express the respective mRNAs, and they are transcriptionally more active than genes transcribed into linear RNA only. (A) Basal (unstimulated) expression levels of mRNAs transcribed from genes that also give rise to circRNAs (red bars; N = 1051) are compared to mRNAs transcribed from genes that give rise only to linear RNAs (no detectable circRNAs; blue bars; N = 21 872). MCF10A RNA-seq data were obtained from a publicly available RNA-sequencing dataset (42). RPKM—reads per kilo basepairs per million reads. P = 6.13e-212, Mann–Whitney-U test. Note that only five circRNAs (leftmost quantiles) displayed no linear counterparts. (B) Basal H3K27 acetylation levels at promoter regions (transcription start site (TSS) ± 3000 bp) were determined in MCF10A cells. The acetylation levels displayed by genes transcribed into both circRNAs and linear RNAs (N = 781; red line) are compared to genes transcribed into linear RNAs with no indication of the respective circRNAs (N = 4992; blue line). The tag counts were normalized to 10 million sequencing tags for each sample. Shown are curves of tag densities of 25 nt bins. Tag density units are presented per basepair (bp) and per gene. Note that H3K27 acetylation levels are higher for genes producing circRNA compared to the control gene set (P = 1.26e-26, Mann–Whitney-U test). (C) Basal DNA methylation levels at the promoter region (TSS ± 1000 bp) of genes transcribed into both circRNAs and linear RNAs (N = 781) are compared to methylation levels displayed by genes that give rise to linear RNA only (N = 4992). DNA methylation data of MCF10A cells was derived from the ENCODE dataset. DNA methylation levels in the promoter region (−1000 to +1000 bp relative to the TSS) of each circRNA-producing host gene and control gene (no evidence for circRNA production) were tallied and a cumulative fraction was calculated and plotted for both groups. Note that DNA methylation levels are lower in genes producing also circRNAs compared to a group of genes giving rise to linear RNAs only (P = 3.15e-12, Mann–Whitney-U test). (D) Basal DNA methylation levels in the region between the TSS and TES (gene body) of genes transcribed into both circRNA and linear RNA (N = 399) are compared to levels of methylation displayed by genes that give rise to linear RNA with no detectable circRNAs (N = 2220). The methylation levels were tallied and normalized to gene length for each circRNA-producing host gene and for control genes (no evidence for circRNA production). A cumulative fraction was calculated and plotted for both groups. Note that DNA methylation levels in the body of genes producing circRNAs are lower compared to a control group of genes (P = 9.46e-57, Mann–Whitney-U test).

