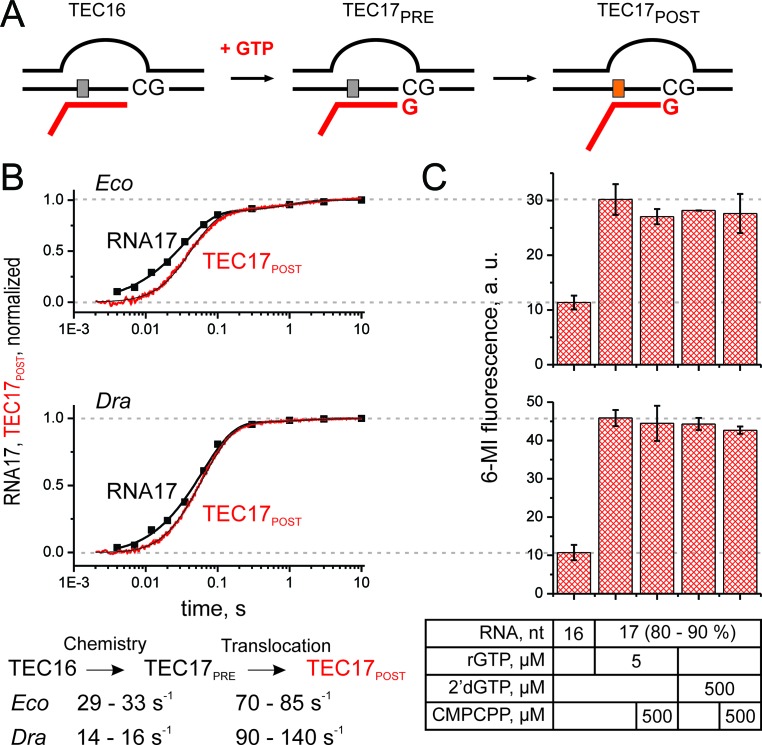
Figure 2.
Comparative analysis of nucleotide addition and translocation by Eco and Dra RNAPs. (A) Schematics of the experiment. RNA was extended with GTP (200 μM) or 2′-dGTP, followed by TEC translocation. Upon translocation the 6-MI base migrates to the upstream edge of the RNA–DNA hybrid with concomitant increase in fluorescence intensity. (B) Time courses of GMP addition (discrete black time points) and translocation (continuous traces) by Eco (top) and Dra (bottom) RNAPs. The schematics of the analyses and the lower and upper bounds of parameters (calculated at a 10% increase in Chi2) are depicted below the graphs. Best fit curves were drawn using best fit values of parameters described in Supplementary Methods. (C) Fluorescent levels of the Eco (top) and Dra (bottom) TECs after assembly and following the extension by GTP or 2′-dGTP in the presence and absence of CMPCPP. Data were averaged over two to three independent experiments. Error bars are standard deviations.

