Figure 4.
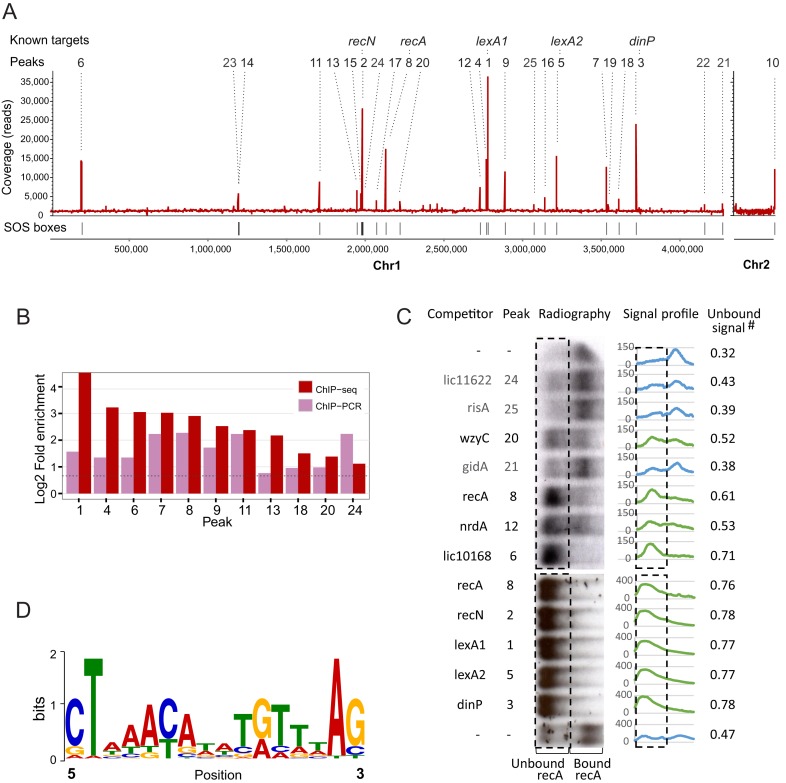
Overview of the results from LexA1 ChIP-seq in L. interrogans serovar Copenhageni. (A) ChIP-seq coverage map, plotted on the y-axis versus chromosomal position on x-axis. All 25 identified peaks are indicated by numbers, ranked from the most to the least enriched in relation to background, as assessed by CisGenome. Identified peaks are indicated above, and peaks associated with previously known targets of LexA1 are named. (B) Validation of ChIP-seq results by ChIP-qPCR of independent samples. Fold enrichment of ChIP-qPCR was calculated using the total sample, and 16S coding sequence as background controls. (C) Binding reactions between labeled recA promoter DNA and LexA1 were challenged by addition of 50-fold excess of unlabeled double-stranded oligonucleotides correspondent to LexA1 binding sites as competitors. The resulting radiographies are tilted 90°, so the rectangles enclose the region where the unbound, outcompeted labeled recA promoter region is expected to be. Signal profiles show the amount of signal present in each lane, and unbound signal is the fraction of total signal that falls within the rectangle. The green profiles correspond to the ones with more than 50% of unbound labeled recA (i.e. LexA1 binds to the tested region), while the blue indicate the ones where the added fragment did not compete. The first and last lanes show binding reactions without competitors added. (D) Sequence logo of the position-specific weight matrix generated by MEME, using the peak sequences. This motif has a P-value of 1.7e-5.

