Figure 3.

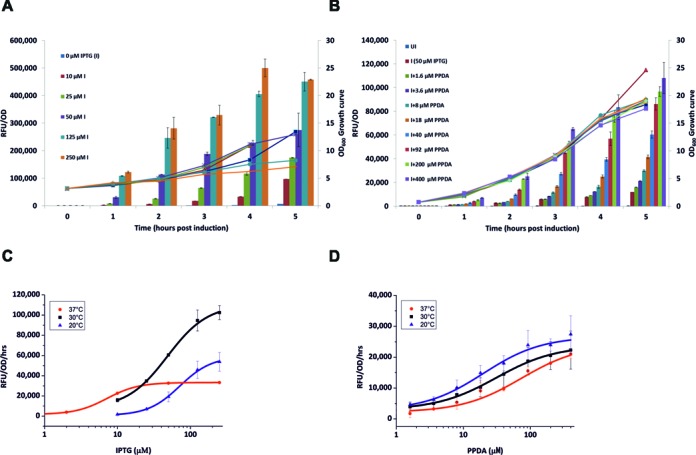
High cell density expression kinetics and performance. The t/t and tT/tT systems were grown at 30°C in 125 ml baffled flasks and induced when in log phase with the indicated concentrations (μM) of IPTG (I) and PPDA (P). Samples were collected at different times post induction and analysed for eGFP expression. A-B, normalized expression RFU/OD600 (bars) and absolute OD600 values (lines) were then plotted versus time for the t/t (A), and the tT/tT systems (B). (C–D) kinetic dose-response data fitted with a four-parameter logistic function of the RFU/OD values at different time points and induction temperatures for the t/t system titrated with IPTG (C), and the tT/tT system titrated with PPDA at a fixed IPTG concentration of 50 μM (D). The data represent the mean of at least two replicates with error bars showing standard errors.
