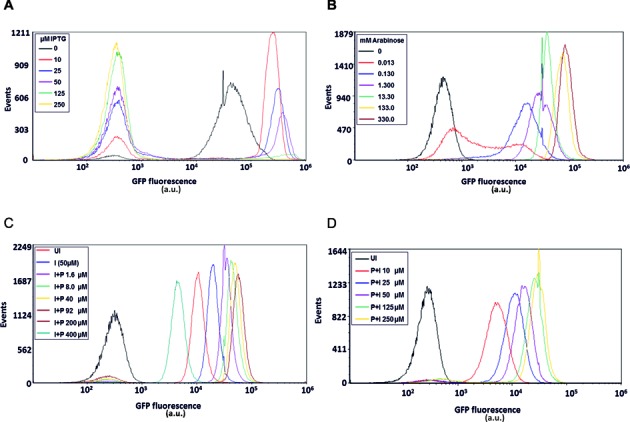
Figure 4.

Single-cell expression analysis. (A–D) flow cytometry analysis of t/t versus IPTG (A), BL21 pBAD-eGFP versus arabinose (B), tT/tT versus PPDA with fixed 50 μM IPTG (C) and tT/tT versus IPTG with fixed 92 μM PPDA (D). Cell populations were grown at 30°C for 20 h under different conditions, (uninduced (UI), IPTG (I) 0–250 μM, PPDA (P) 0–400 μM, arabinose (Ara) 0–330 μM). The data show that the tT/tT system possesses greater cellular homogeneity and stability in gene expression.
