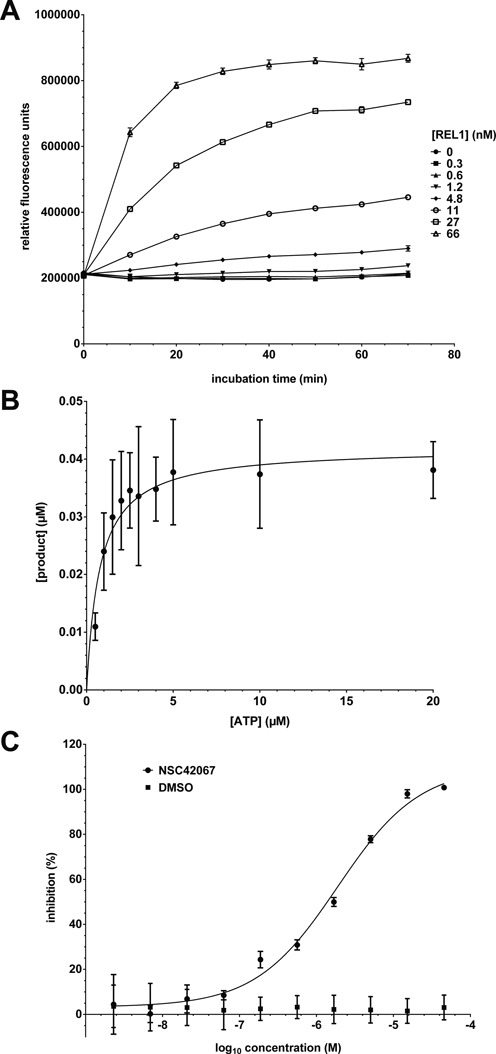
Figure 4.

Kinetic characterization of REL1. (A) Product formation over time. Substrate was incubated with different concentrations of REL1 and urea stop buffer was added after 0–70 min. (B) Determination of Km for ATP. The assay was carried out with varying concentrations of ATP and 50 ng REL1 in a reaction volume of 20 μl. The data were fitted to the Michaelis–Menten equation. (C) Determination of IC50 for compound NSC42067. REL1 activity was measured in the presence of increasing concentrations of compound, calculated as% inhibition compared to the control, plotted and fitted to a sigmoidal curve. All experiments were carried out under optimized conditions, and means and standard deviations for three replicates are shown.
