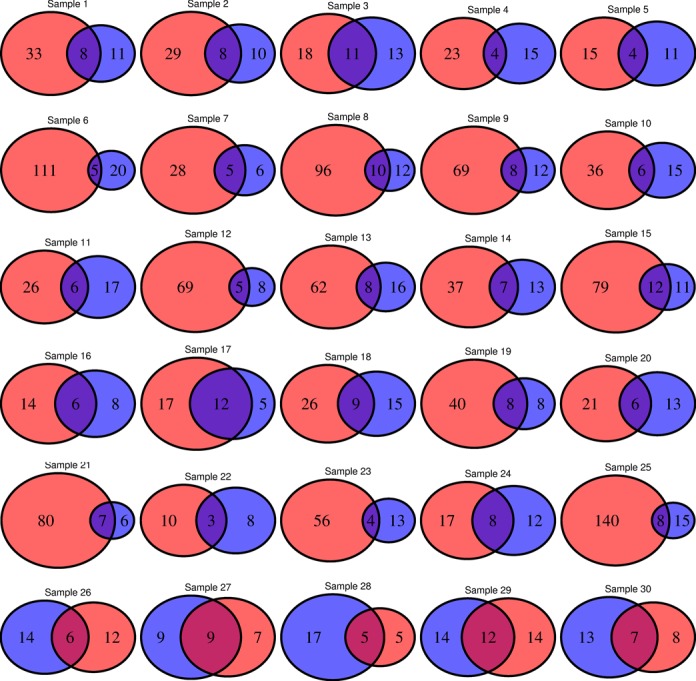
Figure 6.

Venn diagrams showing the overlap of LHV calling for a HNC WES dataset with 30 pairs of matched tumor and normal samples. For each pair, LHV counts for tumor and the matched normal sample are shown in red and blue color, respectively. In most of the samples, number of LHVs in tumor is greater than that of the matched normal except for the last five samples where the numbers are comparable or number of LHVs found in the tumor sample is less the corresponding number in the matched normal sample.
