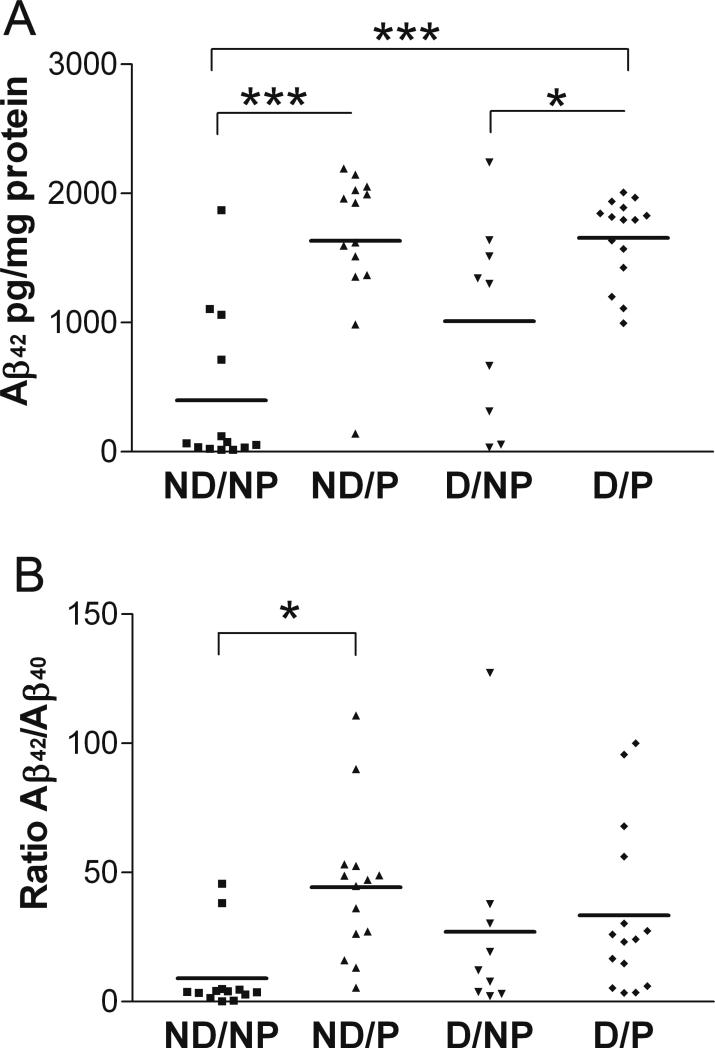
Figure 6. Significant differences between clinicopathologic groups in TBS-soluble Aβ42 (A) and Aβ42/Aβ40 ratio (B) in BA9.
Clinicopathologic groups: (1) ND/NP, not demented with no pathology, control group, n=13; (2) ND/P, not demented with pathology, n=14; (3) D/NP, demented with no pathology, n=9; (4) D/P, demented with pathology, typical AD, n=15. Horizontal bars represent the group mean. One-way ANOVA and post hoc Tukey's test ***p<0.001, *p<0.05.

