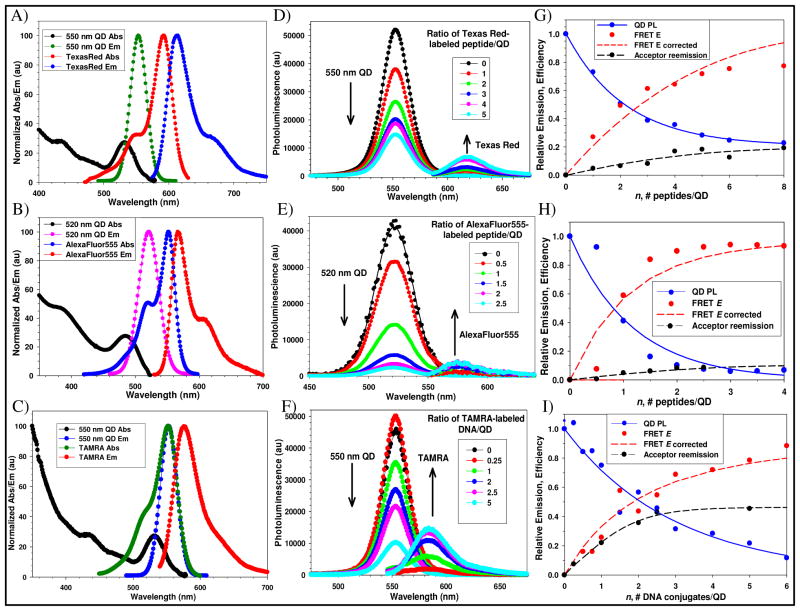
Figure 3.
Representative FRET-data for the QD-conjugate systems. Absorption and emission spectra for 550 nm QDs and Texas Red (A), 520 nm QDs and AlexaFluor555 (B), and 550 nm QDs and TAMRA (C). Deconvoluted and direct-acceptor excitation corrected emission spectra for each QD donor-dye-labeled acceptor system for the relevant increasing number of self-assembled peptide conjugate 3 per 550 nm QD (D), peptide conjugate 4 per 520 nm QD (E), conjugate 5 per 550 nm QD (F). QD spectra were fit with a Gaussian profile. Normalized QD PL loss vs. n (acceptor valence) as indicated, FRET efficiency E, Poisson-corrected FRET E and acceptor reemission for each of the QD-conjugate systems are shown in corresponding panels G–I.

