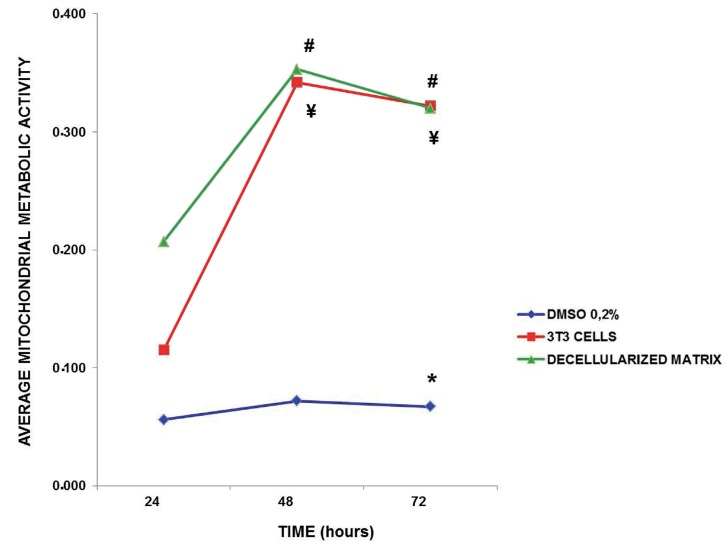
Figure 3. Quantification of mitochondrial metabolic activity of 3T3 cells over time “in vitro” culture. After 72, the 0.2% DMsO group was statistically different its 24 hour baseline time point. The 3T3 cells and decellularized glans matrices groups showed cellular respiration significantly higher at 48 and 72 hours than when analyzed with 24 hours.
(* p<0.028 compared with respective 24 hour time point); (# ¥ p<0.0001 compared with respective 24 hour time point).

