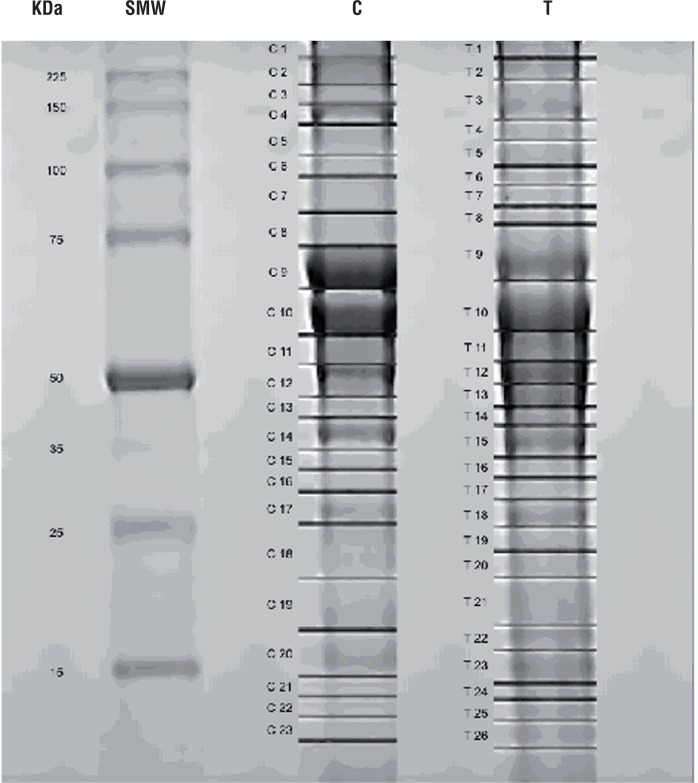
Figure 1. 1DE analysis of tissue samples from SCCP HPV patients and control group. Each pool contained 3.3µg of proteins from each sample, a total of 33µg. The SCCP and control pools were applied on a 12% SDS-PAGE gel. The gel was stained with Coomassie blue G. The markers and numbers in gel represent the sections that were excised for mass spectrometry analysis.
T=penile cancer SCCP; C=control group; SMW=Standard Molecular Weight

