. 2015 Jul-Aug;41(4):773–790. doi: 10.1590/S1677-5538.IBJU.2013.0148

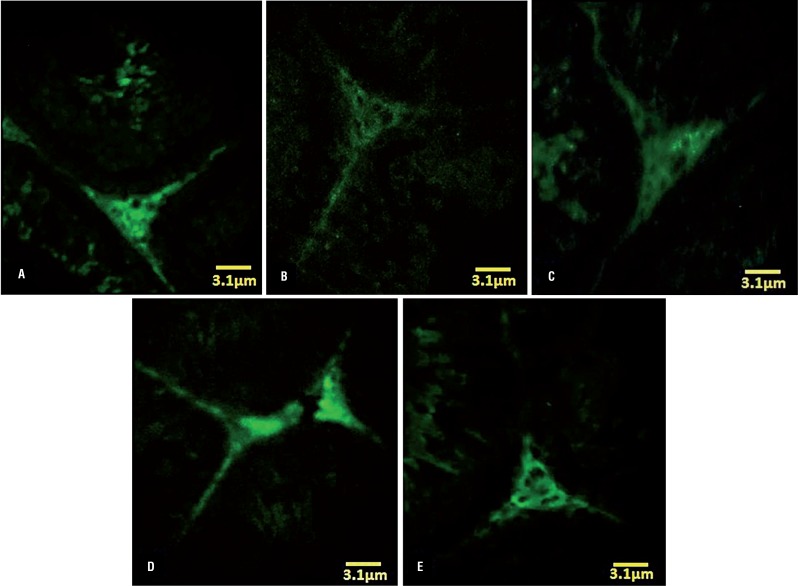
Figure 5. Fluorescent photomicrograph for leydig cells estroidogenesis. (A) Control-sham group: the leydig cells are marked with intensive intacytoplasmic steroid (arrow), (B) Non-treated VCL group: the leydig cells are presented with faint steroidogenic activity; (C) VitE-received group: the VitE improved the steroidogenic activity of leydig cells versus non-treated VCL-induced testis (arrows); (D) DEX-treated; (E) VityE+DEX-administrated group: note the improved steroidogenesis in these groups, which leydig cells are presented close to normal in control-sham testis. Fluorescent staining for leydig cells steroidogenesis (×400); and (F) Effect of Vit E (150 mg/kg) and DEX (0.125mg/kg) on VCL-decreased percentage of leydig cells with steroidogenic activity, the VitE and DEX co-administration remarkably (P<0.05) improved leydig cells endocrine activity.

Figure 5