. 2015 Jul-Aug;41(4):773–790. doi: 10.1590/S1677-5538.IBJU.2013.0148

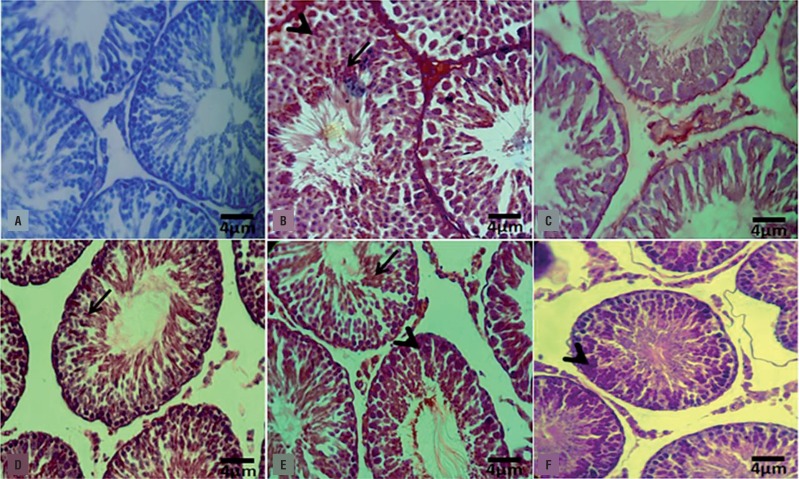
Figure 6. Immunohistochemical analyses for Hsp70-2. (A) negative control; (B) control-sham: intensive Hsp70-2 expression is presented in pachytene spermatocytes (head arrow) and in the cell in spermiogenesis process (arrow); (C) VCL-induced group: the germinal cells are exhibited with remarkable reduction in Hsp70-2 expression; (D) VitE-treated group; (E) DEX-received group; and (F) VitE+DEX-administrated group: the Hsp70-2 expression was back to control condition, which the spermatocyte (head arrow) and spermatids (arrow) are presented with up regulated Hsp70-2 expression. Immunohistochemical staining for Hsp70-2 (×600).

Figure 6