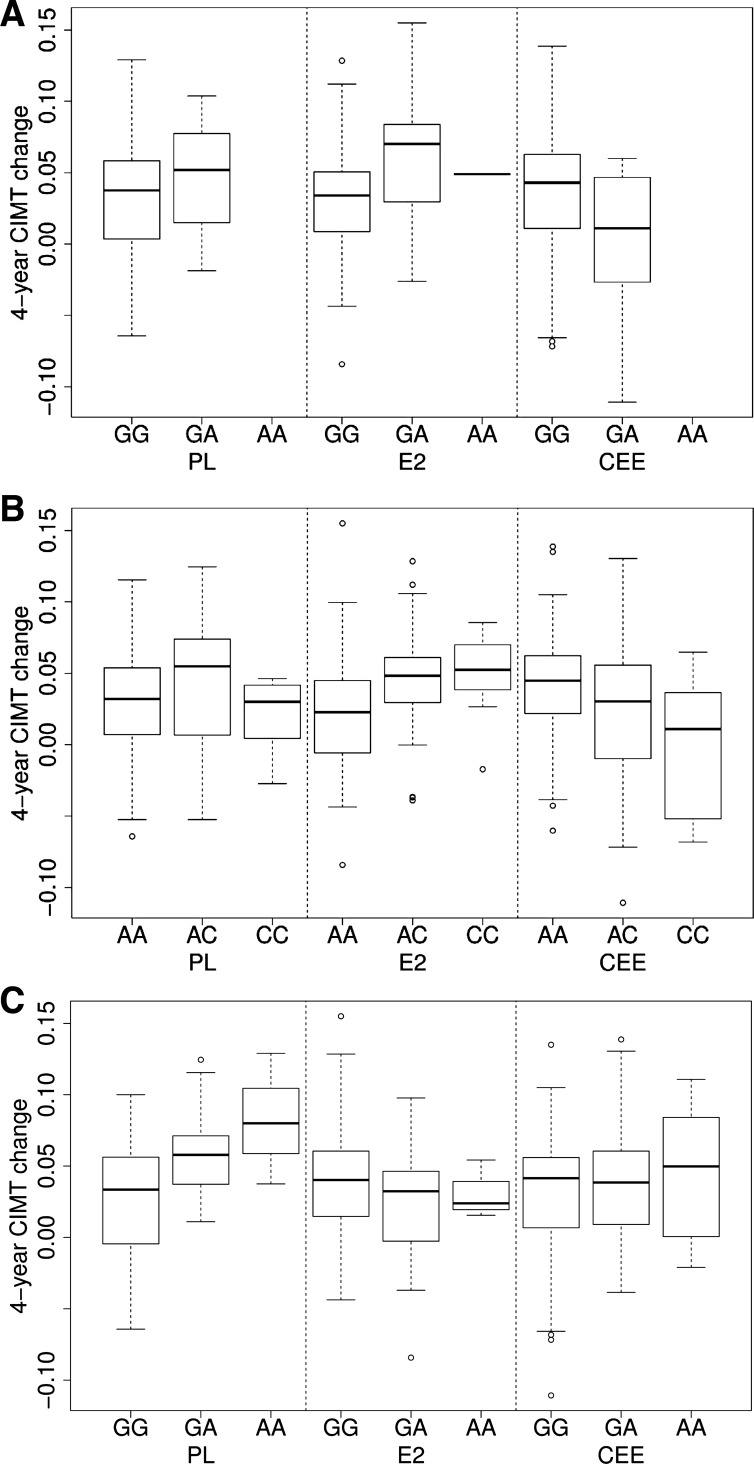
Fig. 2.
Depiction of single nucleotide polymorphisms (SNPs) on 3 genes with the lowest P values of pharmacogenomic association (interaction of SNP and treatment).with respect to change in carotid artery intima-medial thickness (CIMT) from baseline to 4 yr in women who completed the study in each treatment randomized treatment assignment or placebo (n = 160) transdermal 17β-estradiol (E2, n = 119) or oral conjugated equine estrogen (CEE, n = 123). Data are shown as median. The box is the 25th and 75th percentile range; vertical lines represent the 1.5 interquartile range (IQR); points outside the IQR are plotted as is (outliers). Top: r11466536 for gene TGFBR2 (transforming growth factor beta receptor 2). The complex phosphorylates proteins and acts as a transcription factor regulating cell proliferation. Middle: r1569723 for gene CD40, a protein of the tumor necrotic factor superfamily of receptors involved in triggering immunological activation. Bottom: r261060 for gene DOCK2, dictator of cytokinesis 2, encodes a protein involved with small G protein-coupled intracellular signaling. Although these individual SNPs within the innate immunity pathway did not reach statistical significance, the overall pathway analysis that represents the collective analysis of all of the genes/SNPS included in this study did reach statistical significance.

