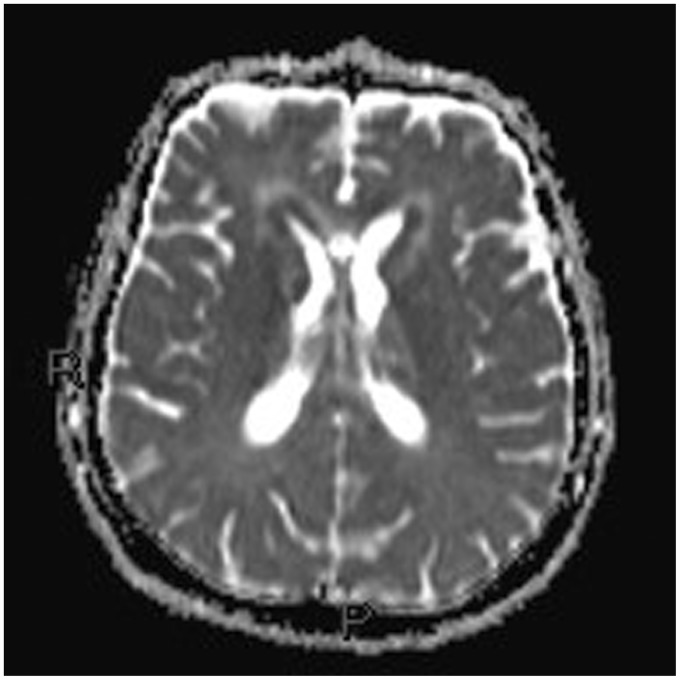
Figure 8.
Diffusion-weighted image b600 and the ADC map: the same plane as Figures 5 and 6 showing periventricular hyperintensity. The core of the hyperintensity shows restricted diffusion in the ADC map, the perilesional hyperintensity in the ADC map corresponds to mild perilesional edema. ADC: apparent diffusion coefficient.

