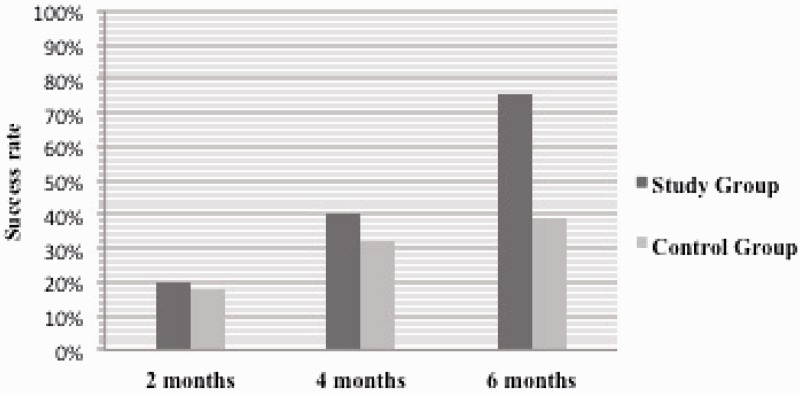
Figure 4.
Graph shows outcomes of study and control group, during the follow-up of six months, according to the pain score. The success rate difference becomes statistically significant only in the sixth month of follow-up, when the procedure was successful in 75.3% of the study group and in 38.9% of the control group (p < .001).

