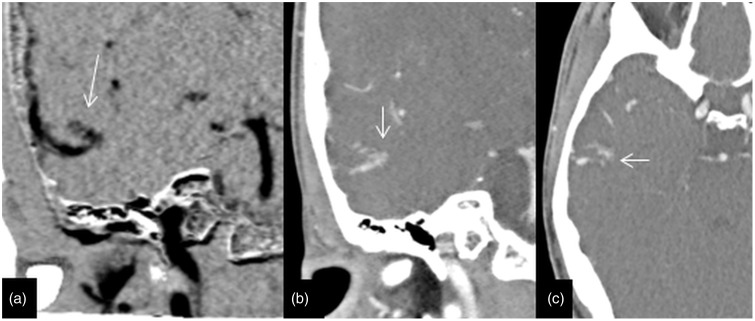
Figure 6.
This row of 4D-CTA images of the same patient in Figure 5 demonstrates the plexiform nidus (arrows) on coronal images in the right temporal lobe; (a) MIP, (b) and (c) axial data of 1 mm thickness. This demonstrates the importance of reviewing the base data to understand and delinate the anatomy of the vascular malformation. 4D-CTA: four-dimensional computed tomography angiography; MIP: maximum intensity projection.

