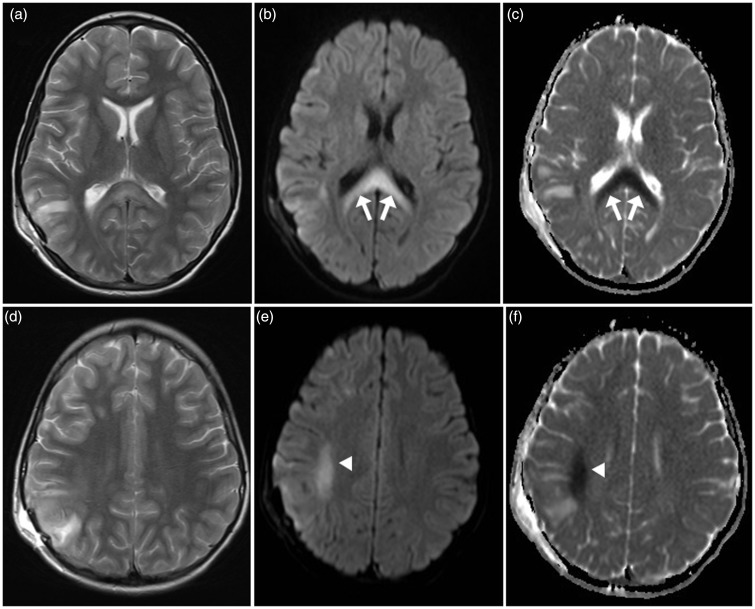
Figure 1.
Initial magnetic resonance imaging (MRI) at presentation: Axial T2 (a) and (d) show high signal intensity in corpus callosum and subcortical region of right parietal lobe. Axial diffusion-weighted imaging (DWI) (b) and (e) and apparent diffusion coefficient (ADC) maps (c) and (f) show restricted diffusion in the corpus callosum (arrows) and in subcortical white matter in the right centrum semiovale (arrowheads).

