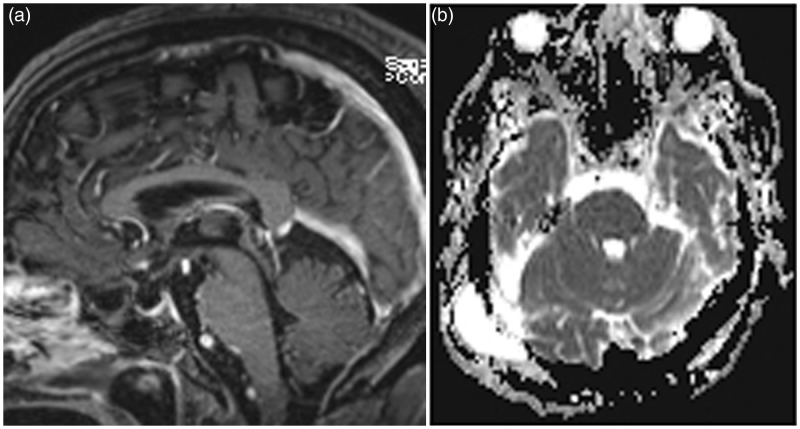
Figure 3.
Sagittal post contrast T1 reconstructed image; (a) shows resolution of the contrast enhancement and disappearance of the prominent surface blood vessels. Axial apparent diffusion coefficient (ADC) map; (b) shows normalization of the previous abnormal signal intensity. Post-operative changes are seen in the right temporo-occipital superficial soft tissues.

