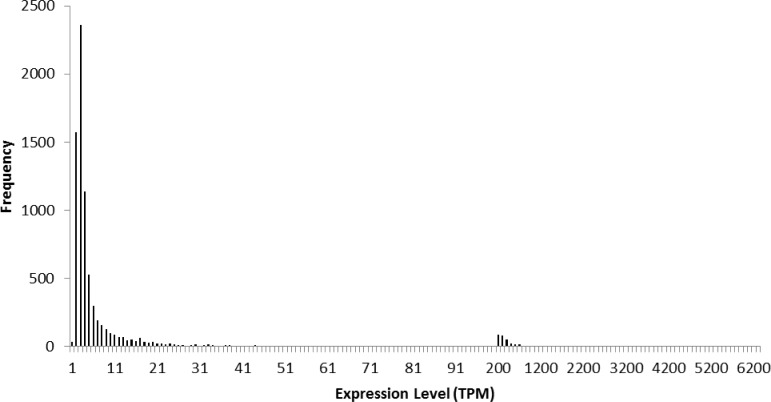
Fig 8. Frequency distribution of expression levels of putative genes expressed in transcripts per million (TPM).
The x-axis indicates expression levels from 0 TPM to 100 TPM with a bin size of 1 and from 101 to ≥ 6200 with a bin size of 100; the y-axis indicates the number of transcripts for a given TPM bin.

