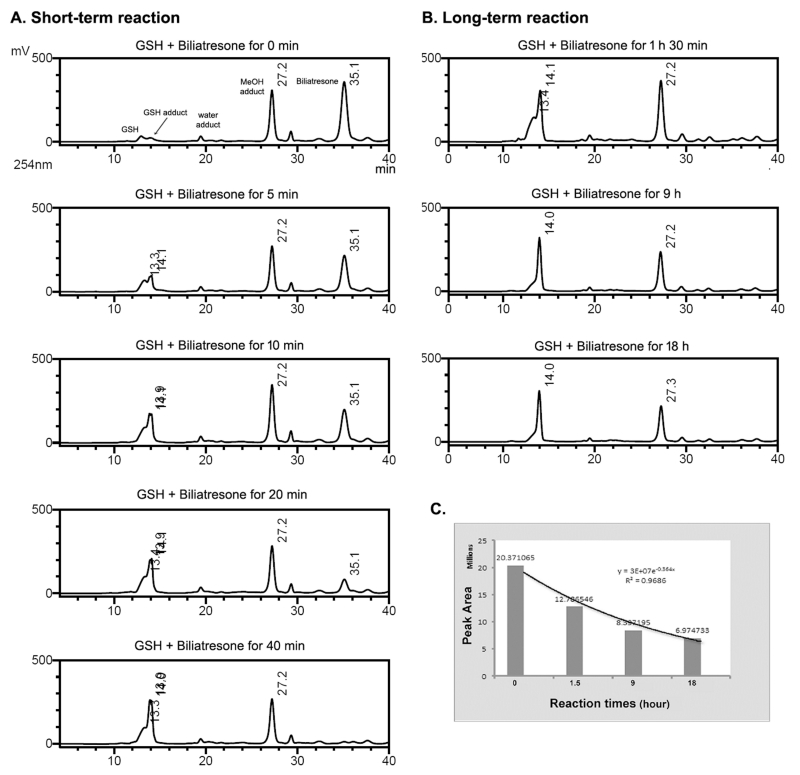
Figure 2.
LC-MS analysis of the time-dependent conjugation of GSH and biliatresone in a short-term reaction (A) for 40 min and a long-term reaction (B) for 18 h. LC chromatograms were monitored at 254 nm to maximize the intensity of the GSH-biliatresone adduct peak relative to the height of GSH. The area of the peak of the MeOH adduct decreased slightly during the reaction. (C) Time course of variation on the peak areas of the MeOH adduct in the reaction. The line is an exponential best-fit line of the peak areas vs. the reaction times.

